Rainfall Totals by City
For those who like the wind, the best place to live would be Chicago, also known as the Windy City. Those of us who enjoy basking in nature’s greenery should be visiting the Emerald City of Seattle at least twice a year. And those who like fruit? Perhaps the Big Apple of New York City.
But where are rain-lovers (or haters) supposed to go? Perhaps those who love it should move to Portland, Oregon whereas those who hate the rain should steer clear of cities in the Pacific Northwest altogether. But is what immediately comes to mind when we think of cities and rain true? Do cities in the PNW actually get the most rainfall? As a map of the rainfall total by city shows us, maybe not. Prepare to be stupefied by which U.S. city gets the most rainfall, the place that gets the least, the rainiest region of the country, and the months of the year that see the most rainfall. We’ve got all the rainfall data you cirrus-ly seek.
View Rainfall Totals by City in a full screen map
The map depicts rainfall data of 282 cities like the rainfall totals of Kansas City, Iowa city rainfall, and the annual rainfall of New York City between 1981 and 2010. The precipitation data is from the National Centers for Environmental Information or NOAA. Precipitation, in this case, indicates “the liquid water equivalent of snowfall” and is in inches.
Which U.S. City Gets the Most Rainfall?
Of the rainfall rates of 282 cities in the U.S., Puerto Rico, and the Pacific Islands you can explore on the map, one stands out. The U.S. city that gets the most rainfall is the non-continental U.S. island of Pohnpei. Pohnpei is one of the Senyavin Islands, which is part of the Caroline Islands. It received an average of 181.22 inches of rain yearly between 1981-2010. Pohnpei tends to receive the most rain throughout May (18.35 inches). It’s least rainy month, February still receives 10.02 inches of rain, which is more than many cities receive in an entire year.
Pohnpei’s rain clouds clearly work in overdrive as the island even receives 24 inches more than the second rainiest place: Hilo, Hawaii. Learn more about Hilo and the other places in and near the U.S. that receive lots of rain on the table below.
Interactive Maps Made Easy
Sign Up Now| CITY | STATE | ANN (INCHES) |
|---|---|---|
| POHNPEI-CAROLINE IS. | PC | 181.22 |
| HILO | HI | 156.79 |
| YAKUTAT | AK | 155.12 |
| KOROR | PC | 147.64 |
| CHUUK E. CAROLINE IS. | PC | 134.54 |
| MAJURO-MARSHALL IS | PC | 127.42 |
| PAGO PAGO-AMER SAMOA | PC | 122.63 |
| YAP-W CAROLINE IS. | PC | 120.93 |
| ANNETTE | AK | 101.63 |
| QUILLAYUTE | WA | 99.54 |
Note that the first (and only) city to appear on the list of top ten rainiest places located in the continental U.S. is Quillayute, Washington. Fans of the Twilight saga may be familiar with this city as the Quileute tribe of werewolves were often seen running in the rain. At least Twilight portrayed accurate meteorology.
Which U.S. City Gets the Least Rainfall?
Pohnpei, Hilo, and Quillayute may receive nearly unbelievable levels of rain, but Yuma, Arizona, may be the most impressive place on the map. The city received an average of zero inches of rain throughout all twelve months of the year, from 1981-2010. Other uber-dry cities include Barrow, Arkansas, which you can see on the table below.
| CITY | STATE | ANN (INCHES) |
|---|---|---|
| YUMA | AZ | 0 |
| BARROW | AK | 4.53 |
| BISHOP | CA | 5.18 |
| LAS VEGAS | NV | 5.37 |
| BAKERSFIELD | CA | 6.47 |
| WINSLOW | AZ | 7.01 |
| ALAMOSA | CO | 7.31 |
| RENO | NV | 7.4 |
| PHOENIX | AZ | 8.03 |
| YAKIMA | WA | 8.25 |
The table contains three cities in Arizona with less than nine inches of rain yearly, two cities in California and Nevada, and one city in Arkansas, Colorado, and Washington. Yakima, Washington’s presence on the least rainy list may be shocking as we just finished telling you about how Quillayute, Washington is the first (and only) city to appear on the list of top ten rainiest places in the continental U.S.
What the Map Tells Us: The Rainiest Region
As is often the case, a map allows us to visually identify trends in data that may not be possible to pinpoint in an Excel spreadsheet. The map is grouped by the average annual rainfall of each of the 282 places in the U.S., Puerto Rico, and the Pacific Islands. Looking at the overall map, we can see that the southeastern United States appears to receive more inches of rain than the much dryer West. Let’s narrow down the rainiest region by selecting different ranges of the average annual rainfall.
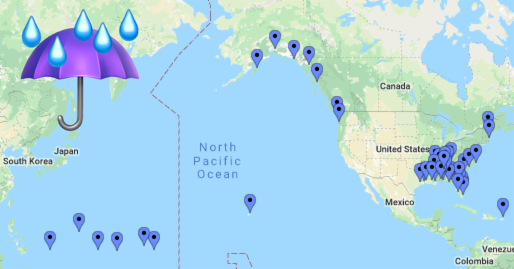
When selecting the largest range (181.22-51.03), we see the majority of markers are located in the non-continental U.S. or down South. Just one city in both Oregon and Washington, along with one city each in Massachusetts and New Hampshire give us northern representation in the continental U.S. for the largest rain range. Several cities in Texas, Florida, and the entire South seem to be rainier than most cities in Oregon and Washington.
Let’s continue adding additional ranges, such as the next largest (50.95-43.21). We see a similar geographical pattern; cities in the northeast and midwest regions of the U.S. don’t pop up until you get to the 43.08-37.72 range. As we veer into 37.57 inches and below, we just start to see Western representation. A majority of Western cities see under 27.74 inches of rain per year, as compared to a majority of the southeast, which is by far the rainiest region with an upwards of 51.03 inches per year.
Mark Your Calendars For the Rainiest Months of the Year
Interactive Maps Made Easy
Sign Up NowThe map’s default grouping is annual precipitation in inches, but we can see the other groupable categories by clicking the dropdown arrow in the bottom lefthand corner of the map. We’re curious about the truth behind common phrases like “June Gloom” and “April showers bring May flowers.”
When averaged, the month of June is typically the rainiest month of the year. The average June rainfall of all of the 282 cities is 3.55 inches. Compare that to February, which typically sees the least rain of the year with just over 2.55 inches. That’s an entire inch difference.
Here is the exact order of the rainiest months of the year:
- June (3.55 inches)
- July (3.50 inches)
- August (3.43 inches)
- September (3.41 inches)
- May (3.32 inches)
- October (3.21 inches)
- November (3.18 inches)
- December (3.10 inches)
- April (2.93 inches)
- January (2.78 inches)
- February (2.56 inches)
While Southern California’s “June Gloom” was proven true, May tends to bring even more rain than April, which debunks “April showers bring May flowers.”
So, what’ll it be: the island of Pohnpei — or any of the Caroline Islands for that matter — or Yuma, Arizona? While you ponder that, see how you can put your own Excel data on the map:
- Export Google Contacts to Excel and Make a Map of Addresses
- How to Print Address Labels from Excel
- Use an Excel Pivot Table to Count and Sum Values
You can use our free mapping tool to visualize the locations in your Excel data.
