Simplify Complicated Data in Excel Spreadsheets
Excel spreadsheets are supposed to make your work easier. However, sometimes you find yourself saddled with a spreadsheet full of data in the wrong columns. Or maybe your spreadsheet contains unnecessary information mixed in with the important stuff. This often happens when copying and pasting or exporting large amounts of data from the web into Excel. You need to simplify your data—just not manually. Seeing as Excel offers hundreds of different features and formulas, you’re faced with another dilemma: how do you start simplifying?
In the spirit of simplification, we’ll demonstrate just three essential Excel skills:
- Separate data into appropriate columns
- Remove unnecessary data
- Join data together
These three Excel skills make simplifying complicated data easy. We find ourselves using them frequently as we prepare location data to make custom maps. Take a look at how they helped us simplify one of our Excel spreadsheets that we eventually turned into a map.

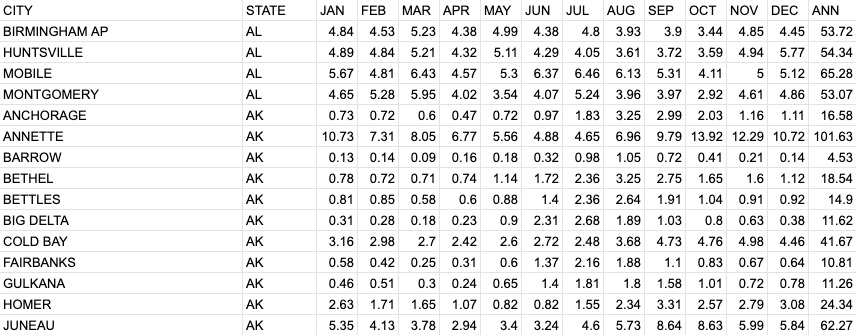
The spreadsheet above contains rainfall totals for 282 U.S. cities which we pulled from the National Centers for Environmental Information. It looks pretty straightforward, right? However, our spreadsheet didn’t start off looking like this. Had it not been for the three Excel skills described—which also work in Google Sheets—it would have taken us hours to manually simplify the data. Below is what we actually started out with.
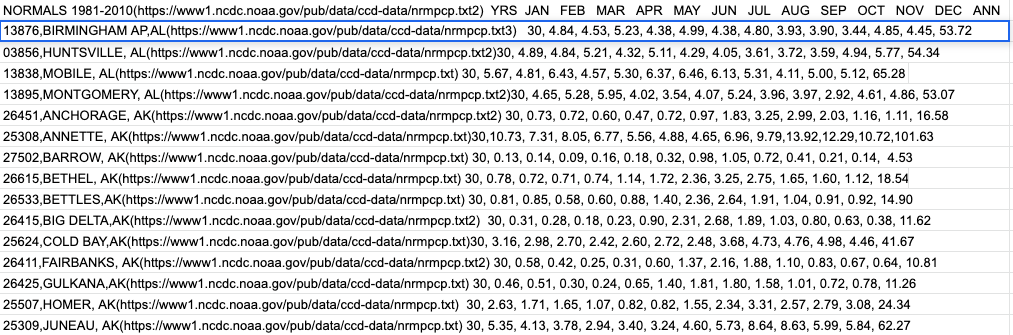
As you can see, the precipitation data for each city is housed in one cell, in one column, and is full of links that we don’t need. Not very useful, huh? Manually separating each of the 282 rows of data into individual columns and deleting the links one by one wasn’t realistic, so what did we do?
Separate Data in Excel by Splitting “Text to Columns”
Excel’s “Text to Columns” feature can detect separations in data (think spaces or commas between data bits) housed in the same cell and will move each individual data piece into its own column. This feature can save you a lot of time in simplifying complicated data with just a few clicks of your mouse. Google Sheets also offers a similar feature.
Interactive Maps Made Easy
Sign Up NowNot only does “Text to Columns” simplify data in instances like above, where all of the data from the web was exported into the same cell, but it also lends a helping hand in common situations where you almost always need to separate data. For example, when you have a city and state or latitude and longitude coordinates in the same cell.
Here’s how to use “Text to Columns” in Excel:
- Select all of the cells you’d like to separate in one column (in our case, we selected cells 1-282 in column A)
- Navigate to the “Data” menu
- Select “Text to Columns…”
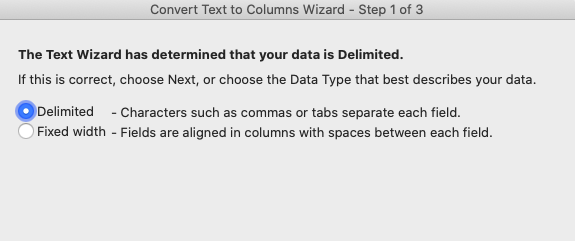
A Text Wizard will appear. Select the type of data you have: either Delimited (characters such as commas or tabs separate each field) or Fixed width (fields are aligned in columns with spaces between each field). Click Next. Depending on your data type, you’ll either set the delimiters your data contains (tabs, semicolons, commas, spaces, or you can customize any other delimiter) or you’ll set the column breaks. Select Next and identify the columns and set the data format. Click Finish.
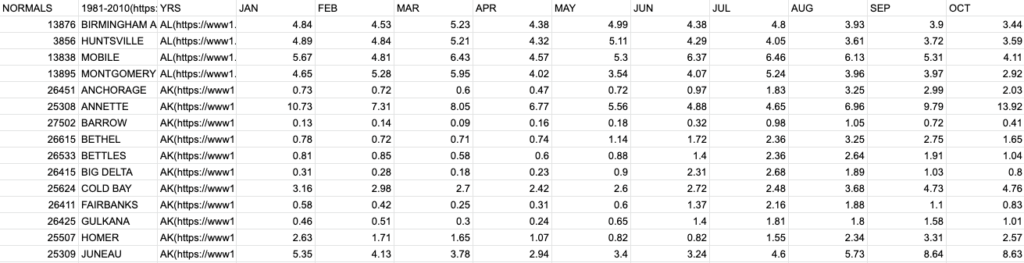
You’ll see from our example data above that while this feature may not immediately yield the perfect spreadsheet, it certainly gets you closer to the simplified spreadsheet you want without hours of manually moving your data into different columns.
Combine Data in Excel with CONCATENATE
The opposite of separating data with text to columns, Excel’s CONCATENATE function can combine data from separate cells into one cell.
Let’s use CONCATENATE to combine each month’s precipitation data into the same cell. This might be useful if we wanted to see all the data in one place or to provide an overview. We’ll leave the city, state, and annual precipitation data in individual columns. To do so:
- Insert a new column to the left of your data or scroll to the right to access an existing but empty column
- Double click the first cell that isn’t a header
- Type the following:
=CONCATENATE( - Add the first cell number you wish to combine (such as B2), followed by a comma
- Optional: to add a space or another separator between the data, type
", ",between each cell number - Continue adding in the cell numbers you wish to combine
Alternatively, copy and paste our formula: =CONCATENATE(E2, ", ", F2, ", ", G2, ", ", H2, ", ", I2, ", ", J2, ", ", K2, , ", ", L2, ", ", M2, ", ", N2, ", ", O2, ", ", P2), making sure to replace our cell numbers with your own. Our formula includes commas and a space between each data point. Once you have just one cell CONCATENATED, simply drag the function down to the rest of your cells to combine all of your data.
You can also use CONCATENATE in Google Sheets and we cover more use cases for CONCATENATE here. But what other Excel skills could we need?
Remove Unwanted Data with Find and Replace Wildcards
Thanks to Excel’s “Text to Columns” feature, our spreadsheet is in a much more manageable state. However, moving data into separate columns won’t remove unwanted data, unless it was already formatted with natural separations. In that case, “Text to Columns” would move the data to a separate column which we could easily delete. This was the case with our precipitation data’s first column: NORMALS. We went ahead and deleted the whole column.
But we also wanted to get rid of the links within our data that weren’t moved to separate columns. If the links were all the same web address, we could have used Find and Replace to copy and paste the repetitive link into the Find what search bar, and replaced it with nothing, thus deleting it. But as you can see in our data, and as may be the case in yours, the links are different. Since we don’t want to manually delete each link, we need to get a little creative with Excel’s Find and Replace feature.
We’ll be using the feature with Excel’s Wildcards, which are similar to Regular Expressions (RegEx) in Google Sheets. Instead of finding and replacing only data that is explicitly written out, Wildcards allow you to remove different data based on criteria you outline. Let’s see when and how this works:
Interactive Maps Made Easy
Sign Up NowYou have all sorts of different, unwanted links mixed in with data you want to keep; they all come after the data you wish to keep, and they all begin with “(”. Using find and replace with wildcards:
- Navigate to the Edit menu
- Select Replace…
- In the Find what search bar, type the following wildcard
,*replacing the comma with the first character of the data you wish to remove —in our case, ( - Select Replace All.
You can follow the same steps listed above if your unwanted data appears before the data you need to keep. Just use the following wildcard instead: *,
Replace the comma with the last character of the data you’d like to remove.
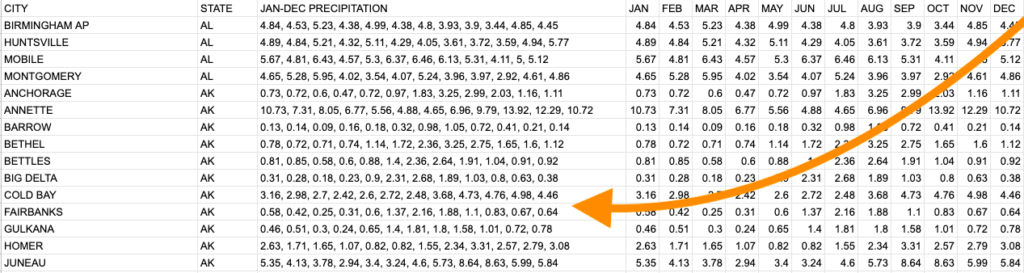
Take a look at our spreadsheet now. You’ll see that all of the unwanted data (in our case, links) that had appeared after the data we wished to keep have been removed. It looks pretty nice, but now what can we do with our data?
Make a Map with Your Simplified Data
Unsurprisingly, we make a lot of maps at BatchGeo. There are many location data sources, but they don’t all have the data in the perfect format. These Excel skills—separating your data with “Text to Columns”, combining data with CONCATENATE, and removing unwanted data with find and replace—help us simplify the otherwise complicated data. Then we make it even easier for others to understand by making a map!
Maps can highlight insights you may have otherwise missed if your data was stuck in a spreadsheet. And with features like map grouping and a heat map function for your Excel spreadsheet, BatchGeo provides even more insights than your average mapping software. Let’s see how our precipitation data looks when mapped:
View Rainfall Totals by City in a full screen map
By mapping our Excel spreadsheet data, we learned that the island of Pohnpei received the most precipitation over the past 30 years and June is the rainiest month of the year. There are even more insights in our post dedicated to the subject: Average Precipitation of 282 Cities.
You can create a map now from your own Excel data. Or, if you’re looking for even more Excel spreadsheet knowledge, here are some advanced Excel skills and formulas to impress your boss.
