How to Prepare Your Data For A Map
You do millions of things to get ready for college, your wedding, a newborn baby, even natural disasters. When you’re prepared, the end result is usually better. Why not do the same for your data? While there are many map making tools on the web, BatchGeo users appreciate the customized Google Maps built right from your Excel or Google Sheets data.
BatchGeo takes its best guess with the additional fields in your spreadsheets, but this post will share some key preparations to get the most out of your map. You’ll learn how to customize your spreadsheet’s groups, remove any extraneous text from the numerical data in your spreadsheet, and separate your date field into individual columns, among other things. So let’s jump into how best to prepare your spreadsheet for a map, starting with your non-location fields.
Know How Many Groups Will Appear on Your Map
There are plenty of instances where you’ll find a data source with more information than just location. In these cases, BatchGeo will take the additional data columns in your spreadsheet and group the data together.
If you want more control over how they are displayed, it can be helpful to know ahead of time how many of the groups in your spreadsheet will appear on your map. BatchGeo will prominently display nine groups, while the rest are classified as Others until you click the “Others” group to view the data within. If you want all of the groups to appear, you’ll need to combined categories until just nine are in your spreadsheet.
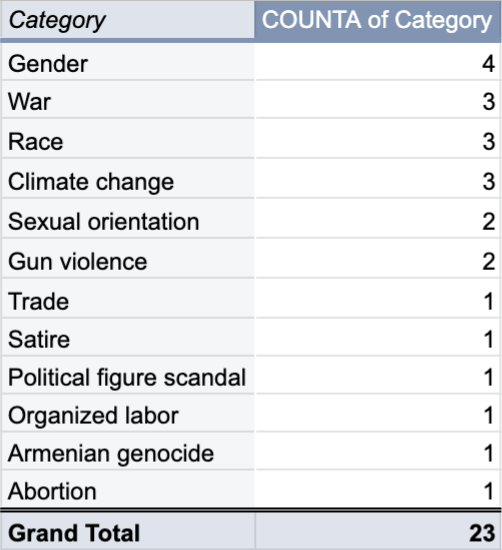
To see how many groups you have, make a pivot table to count your data. Then, sort the table by descending count to isolate the lowest quantity categories. From here you can decide to combine categories together until you end up with nine or so.
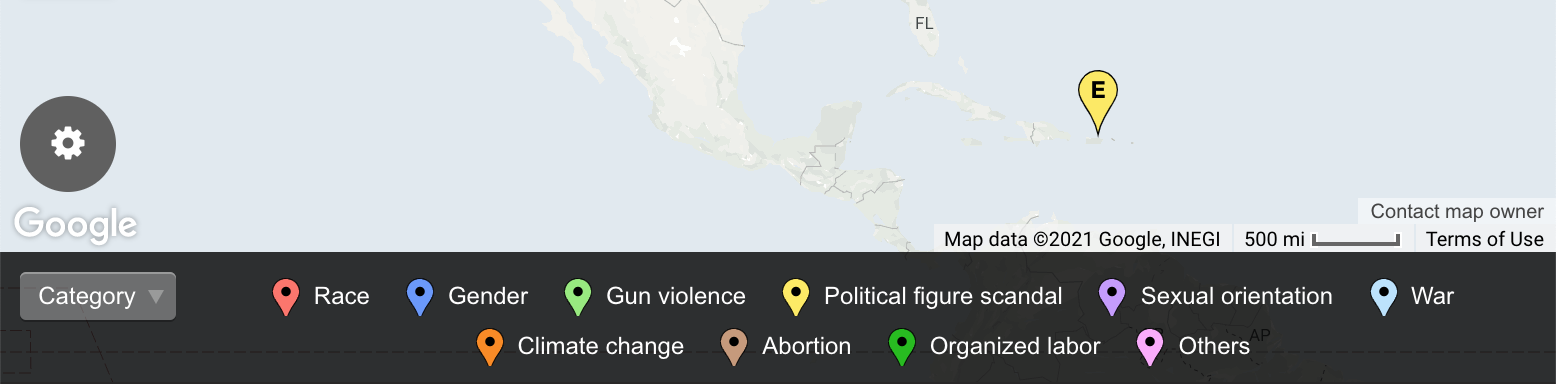
View Famous Protests in American History in a full screen map
Current BatchGeo users might think of these as grouping best practices, though it all boils down to preparing your data beforehand. When your groups include more markers, your map users will better understand the data within. Of course, some grouping data is numeric, which means BatchGeo will create ranges—but only if the data can be interpreted as a number. The next section shows how to remove unnecessary text from your data.
Interactive Maps Made Easy
Sign Up NowRemove Extraneous Text From Numerical Data
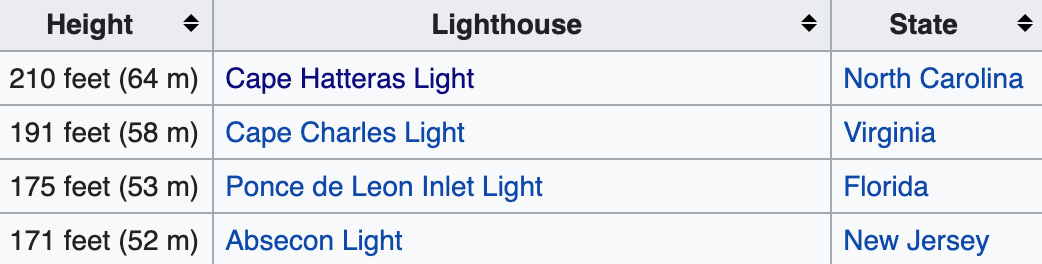
The way BatchGeo groups your additional data like category or type also applies to your numerical data. Take, for example, data about the tallest lighthouses in the U.S. In addition to the lighthouse name and state, the Wikipedia table also contains information about the height, both in feet and in meters.
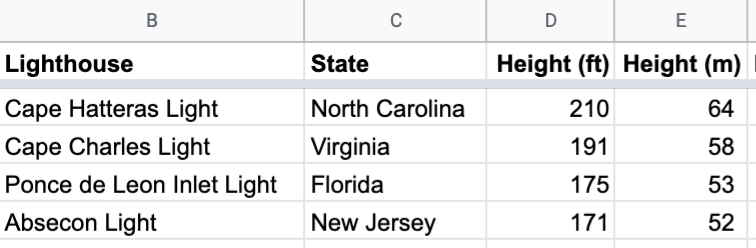
While these details are great, after you add the data into a spreadsheet, you’ll need to do a bit of formatting to get the most out of any metric data. Specifically, you’ll want to separate the two different measurements into their own columns by splitting “Text to Columns”.
Select the column you’d like to separate. In Excel’s “Data” menu, opt for “Text to Columns…” and select what you’d like to split the column based on: Delimited (characters such as commas or tabs separate each field) or Fixed width (fields are aligned in columns with spaces between each field) in the Text Wizard. Finish the Wizard.
But more importantly, you should remove the feet and m, also via “Text to Columns”. For more information about simplifying complicated data in Excel visit our post on the subject.
Instead, you can indicate the measurement in the heading like so:
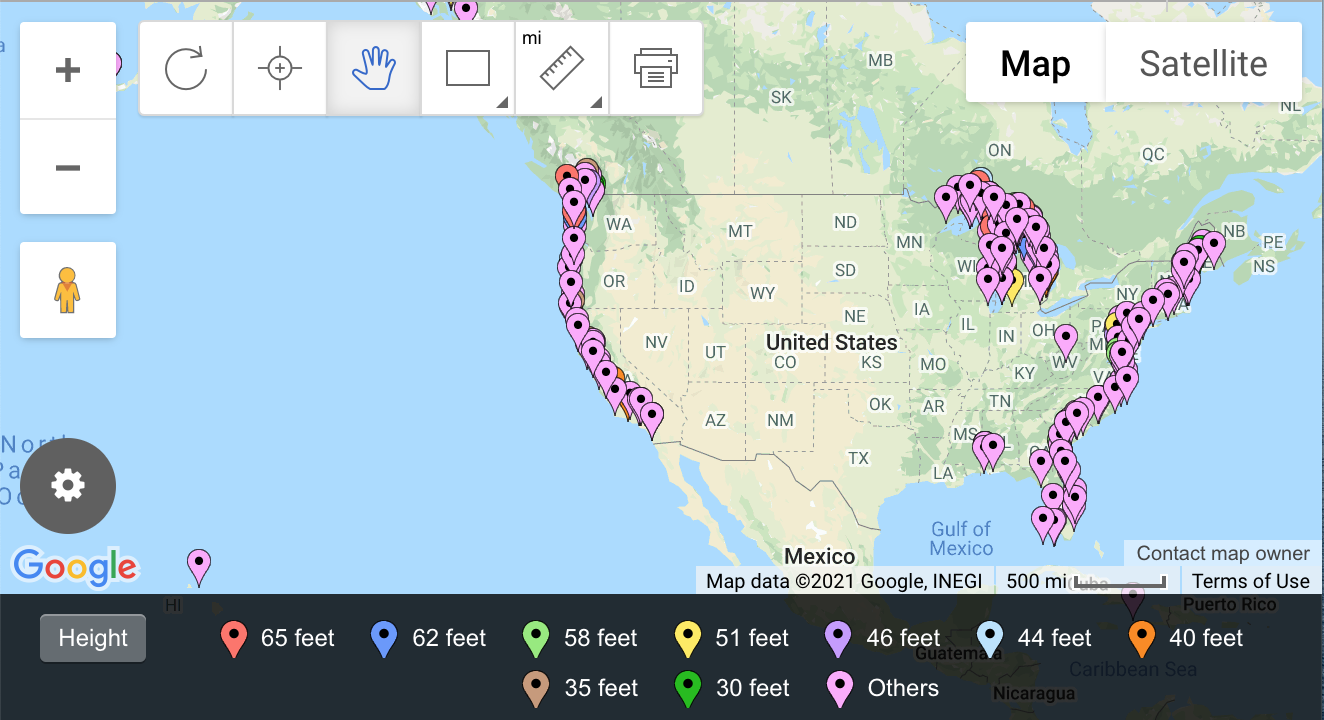
This will enable the numerical data to automatically be detected. When you copy and paste it in BatchGeo to be mapped, the numbers will show as ranges. The map below demonstrates the benefit of removing extraneous text from numerical data to enable ranges:
View Tallest lighthouse in the United States in a full screen map
While this is what your map will look like if you keep the text in:
This applies to more than just the feet and meters in the lighthouse example. Among others, you should do this with numerical such as:
- Length
- Weight
- Volume
- Distance traveled
- Number of occurrences
- Light-years, parsecs, and other measurements
But removing any text from your numerical data isn’t the only thing you can do to prepare your data for a map.
Separate Your Date Data
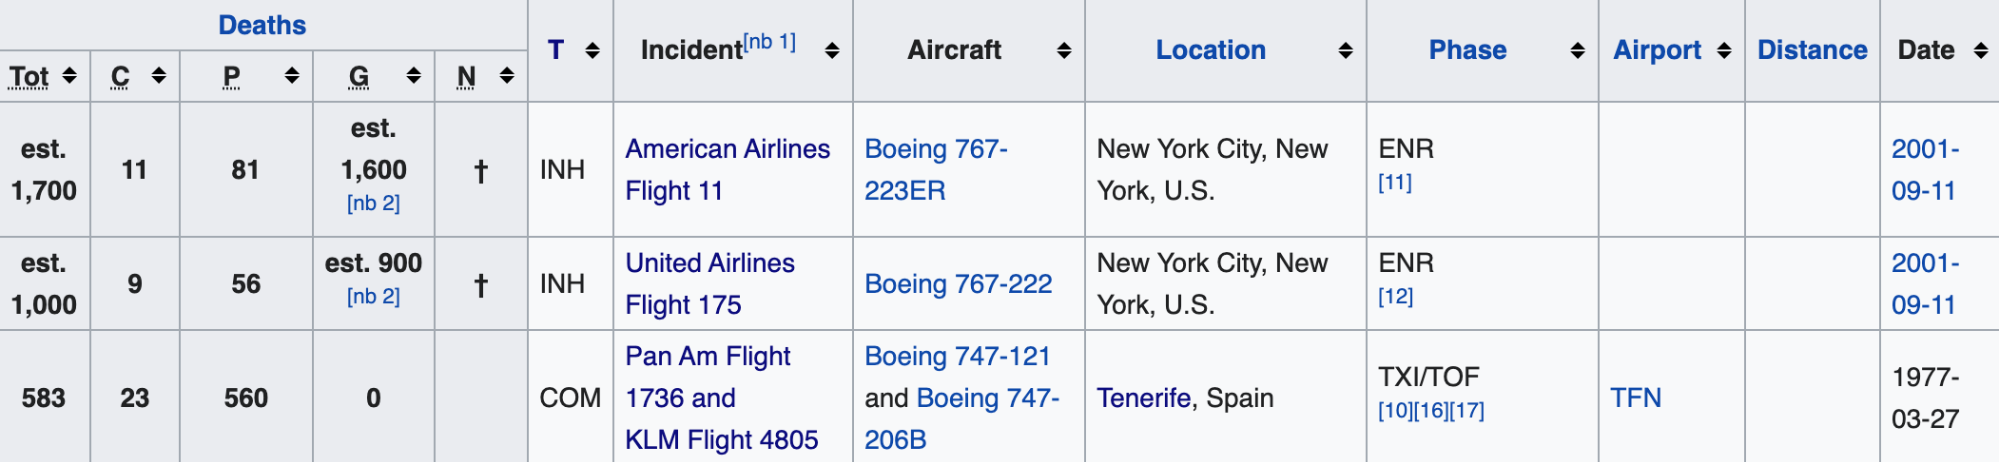
Like types or categories and numerical data, dates also provide important context. For example, dates are included in the table of 550+ Major Plane Crashes. However, more often than not, their format isn’t ideal for a spreadsheet (or a map!). Indeed, you’ll find Pivot Tables and other Excel data analysis tricks used to combine dates for maximum insights. We can do something similar for our maps, but that requires a little data preparation.
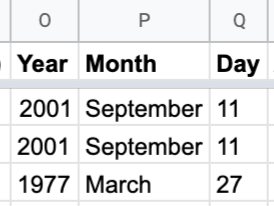
Instead of complete dates, you’ll want the components of a date. For example, 1977-03-27 separates into individual columns for Year, Month, and Day. This way, you’re able to more easily sort your data by month or year (or both!) in your Excel spreadsheet. Furthermore, when you make your map, the months will be grouped together as displayed below when you opt for Month.
View 550+ Major Plane Crashes in a full screen map
The years, on the other hand, will automatically range (i.e. 1938 – 1923) as you can see above when you select Year.
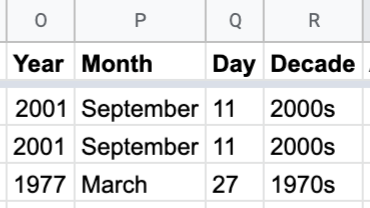
Add Decades For a More Interesting Story
One final way to add even more insight to your data when prepping it is by assigning decades to the information. This can be an interesting way to push together data that may otherwise be looked at separately.
The methods we’ve covered in this post are some of the ways we’ve altered spreadsheets before we make our maps. You can get creative and find more. The overarching theme of all these tips is to look for ways to manipulate the data to maximize how it will look on the map.
Look for the interesting pieces of your data before you map it. Alternatively, paste your spreadsheet in and see what BatchGeo does on the first try. You can always edit and adjust later. This way, you can be sure the most important parts of your spreadsheet are properly highlighted on your map.
Interactive Maps Made Easy
Sign Up NowGet started preparing and mapping your data at batchgeo.com today.
