Increase Your Google Sheets Skills With 5 Tricks
Google Sheets is more than just a place for storing rows of data or running basic calculations. Hidden in its menus are powerful tools that make organizing, cleaning and analyzing information easier and faster. Whether you’re sorting customer lists, calculating your profit or preparing addresses for mapping, these tips can help you get more out of every spreadsheet.
Once you’re comfortable navigating Google Sheets, small tricks can make a big difference in how you view and manage your data. Let’s kick off with one of the smallest settings that’s easy to miss but incredibly handy.
Freeze Rows and Columns
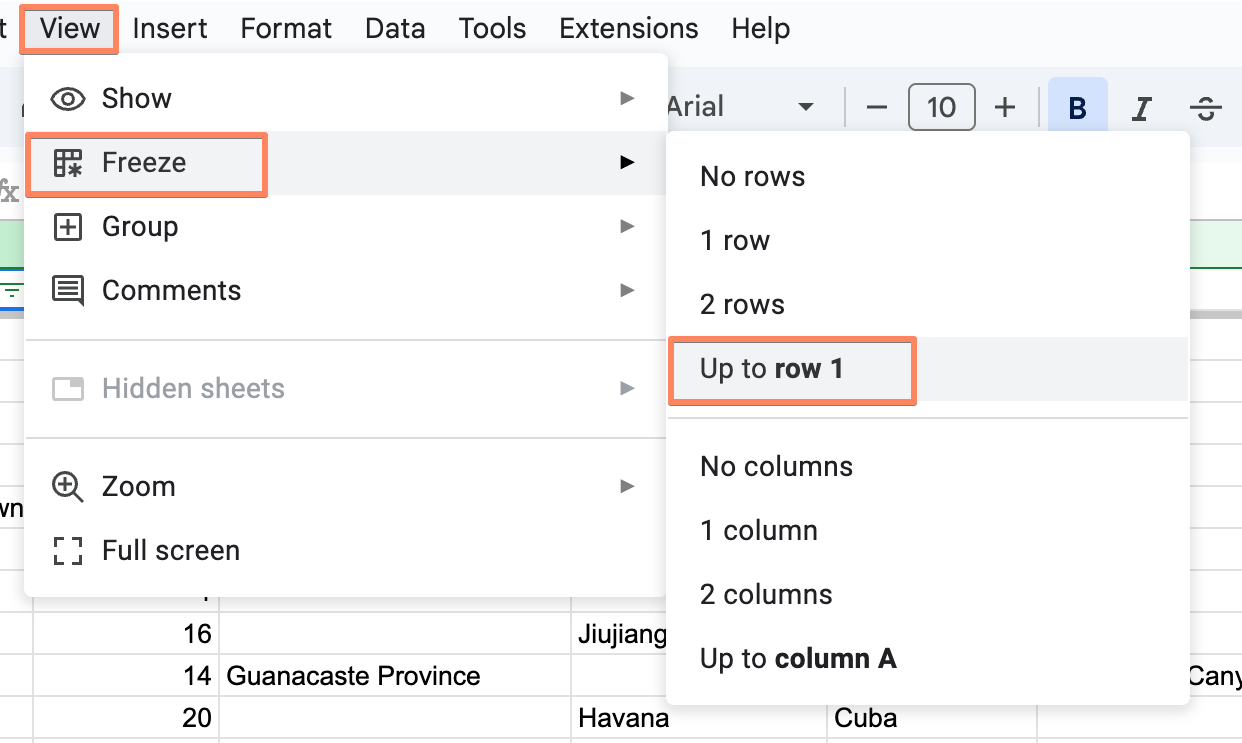
When your sheet stretches past the first few rows, it’s easy to lose track of your headers. If you’ve ever scrolled through tons of rows, you know how easy it is to completely forget which column you’re supposed to be looking at. Freezing rows or columns keeps key labels visible as you look through your data.
To do this, open the View menu, select Freeze, and then Up to row 1 (or Up to column 1) to lock your headers in place. You can freeze multiple rows or columns if your sheet has multiple label sections. In that case you’ll freeze up to the row or column you want. It’s a simple setting that makes working with large datasets — especially address or coordinate lists — much less confusing.
Conditional Formatting for Instant Insight
Conditional formatting helps you spot trends, outliers, or errors at a glance by changing how cells look based on their values. You can highlight anything from missing data to unusually high numbers without manually checking each row.
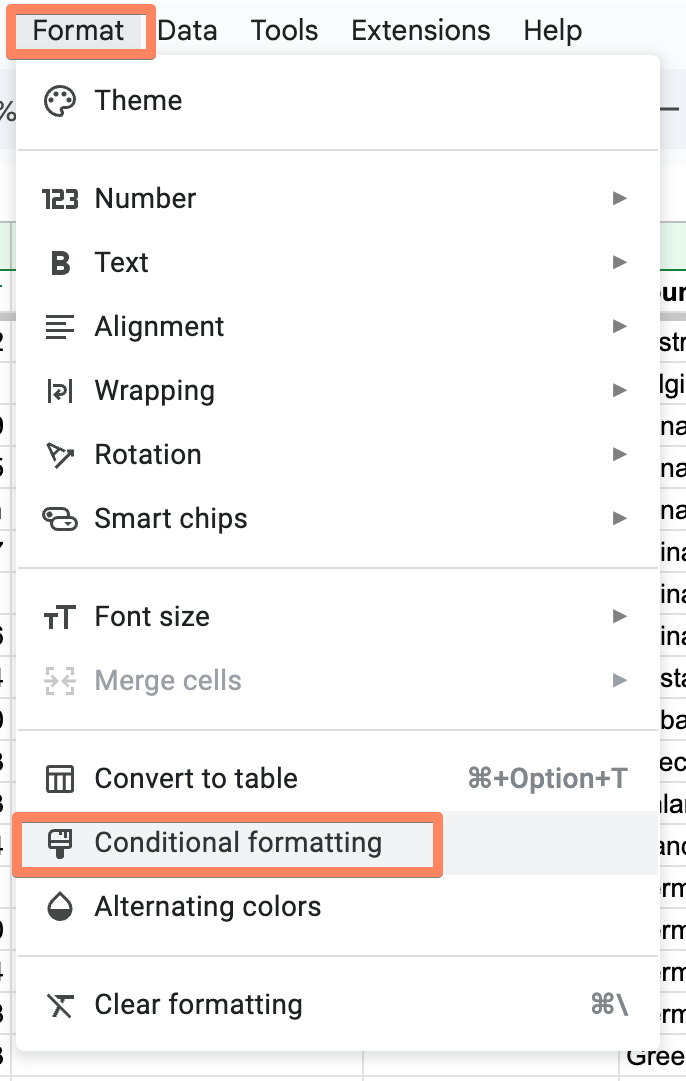
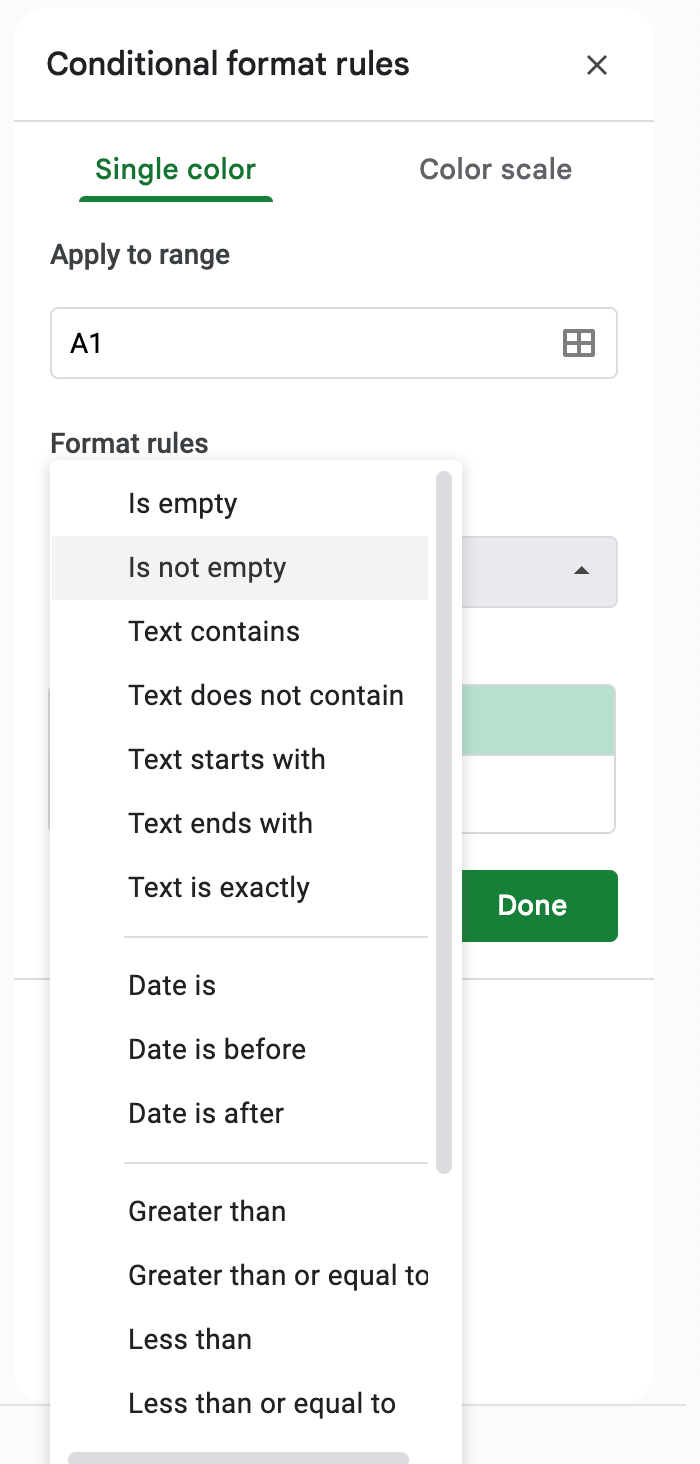
To set up, select your range, then Format → Conditional formatting. Choose a rule such as greater than, text contains, or is empty, and pick a color scheme. For example, you can shade all sales above a certain threshold in green or flag missing coordinates in red before you import data to BatchGeo.
If you’re using Excel, check out our article on conditional formatting.
Split Text into Columns
In raw data, you might see combined text like “Seattle, WA” or “John Smith – Portland.” That makes it difficult to use the data without first ensuring everything is standardized. Instead of editing each cell by hand, you can separate that information into multiple columns with a few clicks.
Interactive Maps Made Easy
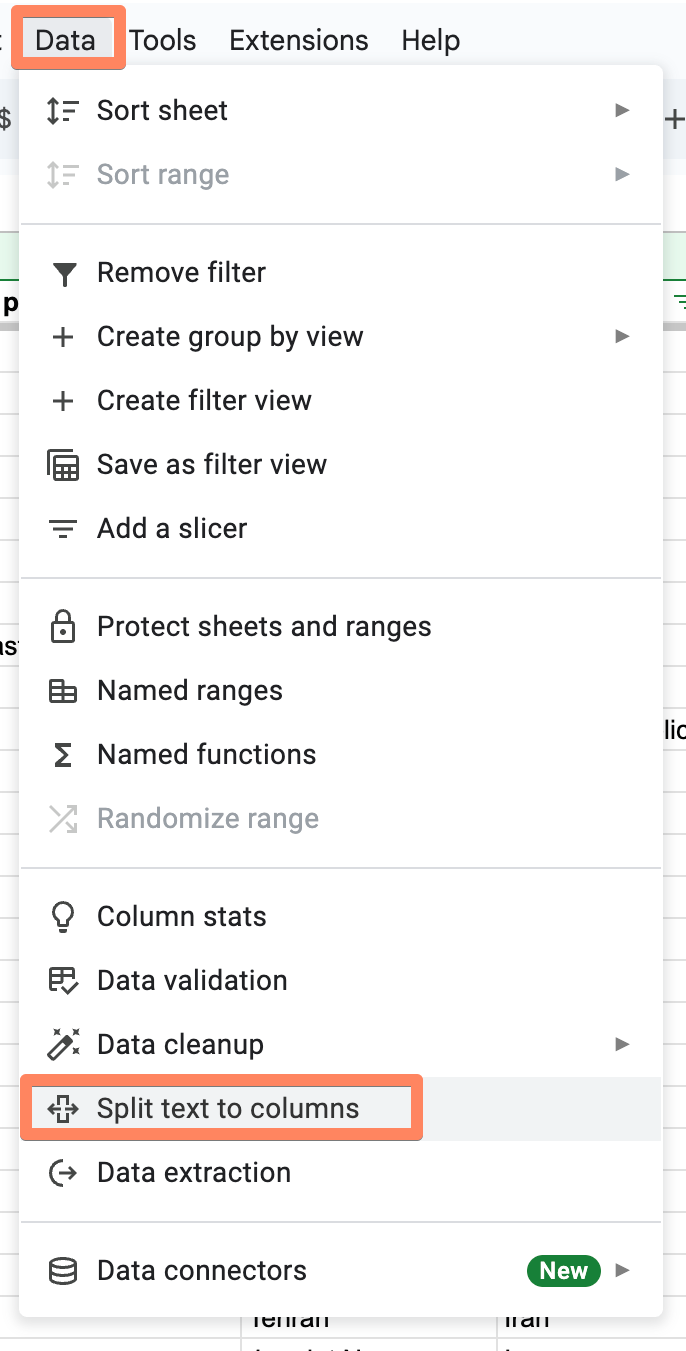
Sign Up NowHighlight the column you want to split, then choose Data → Split text to columns and select your separator. Sheets will then separate the text using your selected separator you can allow it to detect the separator automatically.
Combine Data with Formulas
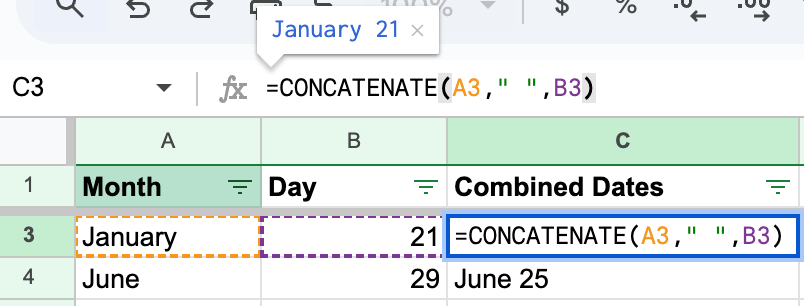
Sometimes you need to do the opposite of splitting text and bring information back together. While there isn’t a single setting for this, you can combine cells and build full names, addresses, or other labels via formulas
Use =CONCATENATE(A2,” “,B2) to join two cells with a space in between. You can also use =TEXTJOIN which works like an advanced version of CONCATENATE. It lets you merge a range of cells and choose whether to include blanks or not. These formulas help keep your sheet neat and consistent while saving time on repetitive edits.
Data Validation to Create Drop-Down Lists
Data validation keeps your sheet consistent by controlling what can be entered into specific cells. Instead of typing freeform text, you can create a drop-down list of options, reducing typos and mismatched entries.
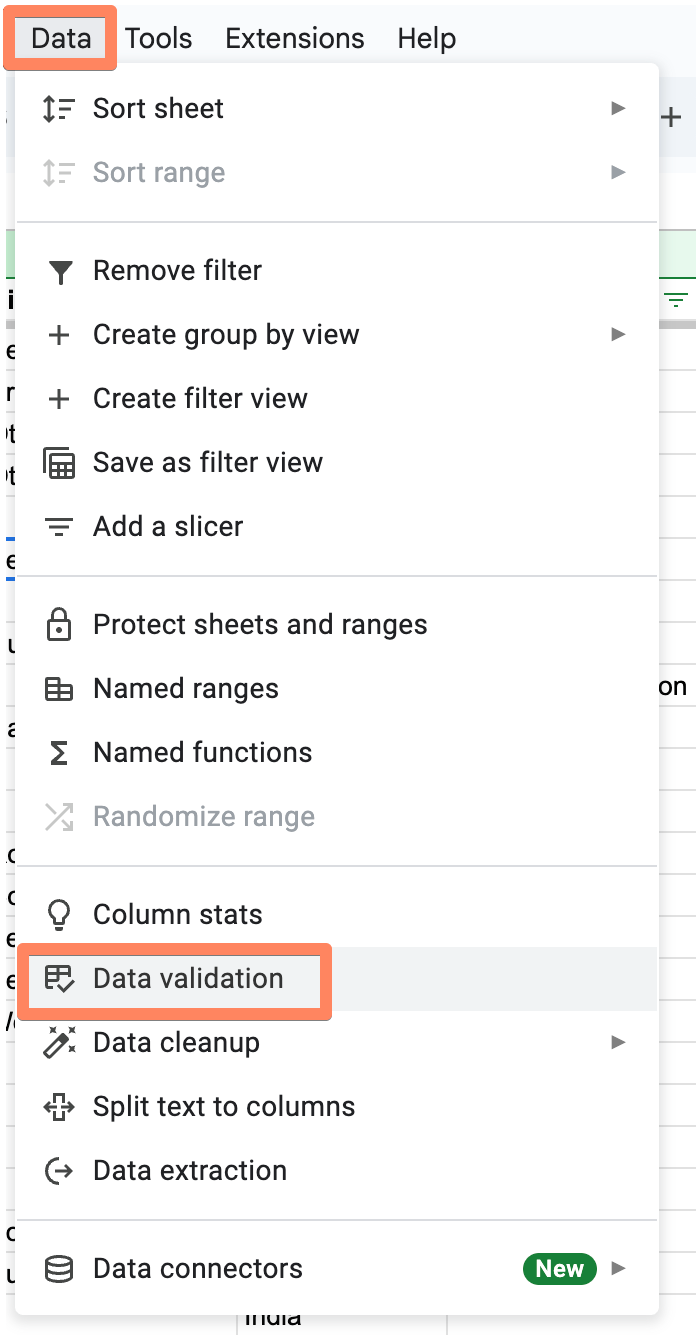
Select the cells you want to limit, then head to Data → Data validation.
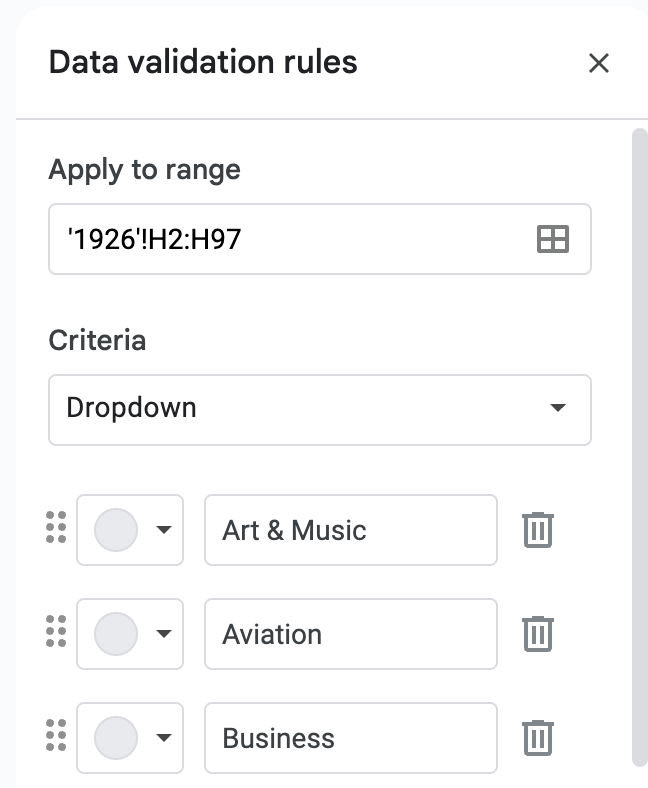
Under “Criteria,” choose Dropdown and enter your options. From there, you’ll see a dropdown list in each cell where you can pick from the list. It’s a straightforward way to keep shared sheets accurate and uniform.
Create Your Own Map
Once your data is clean, organized, and easy to navigate, you can take it a step further by turning it into something visual. A spreadsheet full of names, addresses, or coordinates becomes much more meaningful when you can see it on a map.
BatchGeo makes that process simple. Paste your data, choose your columns, and watch your map come to life. It’s free to try and a great way to explore patterns in the data you already have.
