Pinpoint 569 Shipwrecks in International Waters
Everyone knows about the sinking of the Titanic, perhaps in part due to Kate Winslet and Leonardo DiCaprio’s heartbreaking portrayal of a fictional couple aboard. While we also all acknowledge that there was more than enough room on that door/raft, many people can’t name any other international shipwrecks, even those that took place more recently than the Titanic. Yet, 569 international shipwrecks took place between 1628 and 2015 and all had their own tragic backstories. Let’s take a look at where the final resting places for these ships are located via the map below.
View International Shipwrecks in a full screen map
We gathered information about the 569 international shipwrecks from Wikipedia and its subpages. Note that there are even more mappable shipwrecks that took place in domestic waters but we didn’t want to go overboard with data.
Group the map by ocean, subregion, or the smaller bodies of water to see where most of these wrecks reside, or read on for more information about their oceanic locations.
Shipwrecks by Ocean
Seventy-one percent of the planet is ocean, which has been divided into four ocean basins for geographical, cultural, and scientific reasons, per the National Ocean Service. The original four basins were the Atlantic, Pacific, Indian, and Arctic oceans though most oceanographers now recognize a fifth basin: the Southern Ocean. You can sort the map by these basins, though we summarize the ocean basins and their shipwreck count below.
- Atlantic Ocean – 323 shipwrecks
- Pacific Ocean – 158
- Indian Ocean – 56
- Arctic Ocean – 29
- Southern Ocean – 3
Being only the second largest of the world’s oceans doesn’t stop the Atlantic Ocean from claiming the most shipwrecks. Almost 57% of international ships have gone down there while the Pacific Ocean (the #1 largest ocean) has half the amount of shipwrecks. However, the Atlantic was the body of water between European explorers and the New World. Frequent travel likely propels it to this grim number one position.
The coldest of all the oceans, the Arctic Ocean is partly covered by sea ice year-round. Due to this, it is less frequently travels, so it has a lower number of wrecks when compared to the other oceans. The same goes for the Southern Ocean (also known as the Antarctic), which has temperatures between −2 to 10 °C (28 to 50 °F). Recognized in 2000, only three shipwrecks have occurred there: in 1819, 2007, and 2010. The 1819 wreck of the San Telmo resulted in the deaths of 644 people, possibly the first to die in the ‘future’ Antarctica. Additionally, San Telmo Island off the north coast of Livingston Island is named after the ship. But what about the number of shipwrecks in more specific regions of each ocean basin or even in bays, channels, and seas?
Interactive Maps Made Easy
Sign Up NowOcean Bays, Channels, Seas, and Subregions Where Ships Sink
Each of the five ocean basins has subregions such as the North Pacific, South Pacific, Mid-Atlantic, South Atlantic, or Central Indian Ocean. Of these, the North Pacific subregion has been the site of the most wrecks: 124.
Additionally, there are 33 bays, channels, and seas within the ocean basins and their subregions. Of these, the Mediterranean Sea (between Southern Europe and North Africa) is the most common for shipwrecks; 129 to be exact. Sixty-two wrecks have taken place in the North Sea, the second-most, including the Bourbon Dolphin shipwreck.
Over 20 shipwrecks occurred in each of the Norwegian, Phillippine, South China, and Baltic seas. Then there are 27 more bays, channels, or seas with one shipwreck or more. To decrease the chances of a shipwreck, even in one of these locations, it’s helpful to know the months shipwrecks occur most often.
Dangerous Months for Ships
Do ships tend to sink more often when faced with the icy waters of winter months? Or are wrecks more common throughout the summer months when ships may sail more frequently? Let’s find out.
| Month | Number of shipwrecks |
|---|---|
| May | 65 |
| June | 61 |
| April | 50 |
| February | 48 |
| March | 46 |
| December | 46 |
| September | 45 |
| October | 45 |
| November | 45 |
| August | 45 |
| July | 36 |
| January | 32 |
As you can see from the table above, May is the month of many wrecks. Forty-six of the 65 May shipwrecks occurred in the vast Atlantic Ocean. June, too, has seen a lot of ships sink, as has April. It would appear that the Northern hemisphere’s late spring and early summer is the time of year when international ships tend to go down.
On the other hand, the month of January has only seen 32 international shipwrecks between 1628 and 2015. In addition to January, the months of July and August-November seem to have calmer waters. It’s interesting to see May and June rack up high numbers while the months immediately following have 20+ fewer shipwrecks. Get an even better idea of the months, years, and even days when wrecks occur by grouping by time period on the map.
Group and Filter the Map by Multiple Columns: Oceans & Months
With BatchGeo you can group and filter any of your maps by a data column. For an even more detailed view, you can filter your maps with multiple column values at the same time.
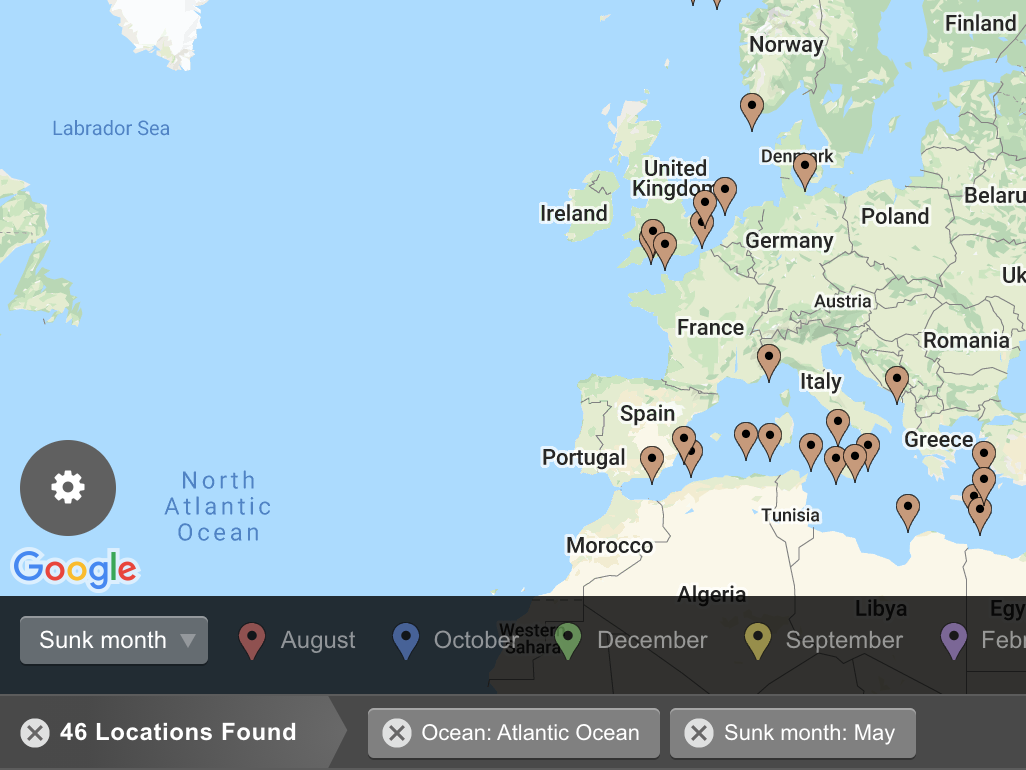
For example, on the map of international shipwrecks, select the Atlantic Ocean from the ‘Ocean’ category so the map only displays wrecks in that basin. To add a second (and third and fourth and so on, if desired) column to the filter—like the month of May— select an additional category, which will keep the Atlantic Ocean filter from before. Note that you can do this with any of your maps made with BatchGeo, making map data analysis easier than ever before.
In the case of international shipwrecks, most occur in the Atlantic Ocean during May, which we easily discovered thanks to multi-column map grouping and filtering. Other ocean-related maps available for your perusal include the busiest ports worldwide and every US shark attack fatality since 1900, which are made with the help of BatchGeo’s online mapping tool.
