Do Personal and Public Debt Go Hand in Hand? A Map of 84 Countries by Their Debt
Financial success can be measured in many ways. Net worth, emergency funds, and debt are all taken into account. Anyone or anything can owe money, which is why there are different types of debts—from personal to those incurred by an organization or government.
In this post, we’ll highlight the highest average household debt (Switzerland) and public debt (Japan) of the 84 countries on the map below, the biggest changes throughout the years to see how the two types of debts compare.
View Countries by debt in a full screen map
Switzerland Is Not Switzerland & Other High Household Debts
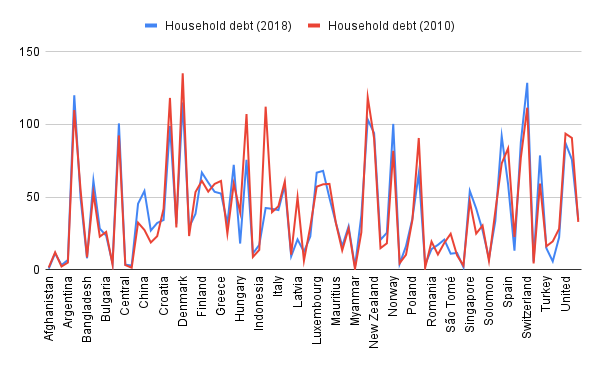
The map shows how much amount of money all adults in a country’s household owe financial institutions, including consumer debt and mortgage loans as a percentage of GDP—called household debt—of 84 countries in 2018 and 2010. The highest of these, as of 2018, are as follows:
| Country | Household debt as a % of GDP (2018) | Household debt as a % of GDP (2010) | Percentage change between 2018 and 2010 |
|---|---|---|---|
| Switzerland | 128.7% | 111.53% | 15.39% |
| Australia | 120.14% | 109.9% | 9.32% |
| Denmark | 115.15% | 135.29% | -14.89% |
| Netherlands | 103.42% | 118.74% | -12.90% |
| Canada | 100.68% | 92.44% | 8.91% |
| Norway | 100.35% | 81.85% | 22.60% |
| Cyprus | 98.94% | 118.27% | -16.34% |
| New Zealand | 94.04% | 90.28% | 4.16% |
| South Korea | 91.93% | 73.17% | 25.64% |
| Sweden | 87.87% | 77.08% | 14.00% |
Switzerland certainly fails to live up to its reputation of neutrality—at least where household debt is concerned. While the middle ground household debt of all 84 counties on the map is about 39.88% of GDP, this is one average Switzerland surpasses—along with the household debt of every other country. The country is known for being the world’s wealthiest per capita, but it’s also one of the most expensive countries in the world. Understandably then, late payments (of taxes, insurance premiums, rent, mortgage interest, utilities, etc.) are the most common reason for Switzerland’s high household debt being the highest.
Interactive Maps Made Easy
Sign Up NowHowever, this wasn’t always the case. In 2010, Denmark’s household debt (135.29% of GDP) was far greater than Switzerland’s (111.53%), though the Danish managed to decrease that significantly by 2018. However, this is far from the biggest change, positive or negative, in household debt between 2010 and 2018.
Biggest Changes in Household Debt Over the Years
In the case of debt, being negative is actually a positive. There are quite a few countries that, like Denmark, managed to lower their household debts in the eight years between 2010 and 2018. The greatest decreases include:
- Ukraine (-70.85% household debt decrease)
- Ireland (-62.19%)
- Latvia (-58.27%)
- Afghanistan (-55.94%)
- São Tomé and Príncipe (-55.67%)
- Hungary (-54.64%)
- Sri Lanka (-41.89%)
- Sierra Leone (-41.03%)
- Spain (-29.50%)
- Iceland (-29.42%)
In 2010, Ukraine’s household debt was 19.42% of GDP. By 2018, the country managed to lower that number by 70.85% to just 5.66, the 11th lowest in the world. Both Afghanistan and Sierra Leone’s debt decreases also placed them among the top 10 countries with the least amount of debt. Afghanistan’s decrease of 55.94% makes it the #1 country with the lowest debt on the entire map (0.63% of 2018’s GDP). Similarly, Sierra Leone reigns at #2 with 1.61% of GDP thanks to their citizen’s thrifty ways between 2010 and 2018.
On the opposite end of the debt spectrum are the giant increases of certain countries from 2010 to 2018. Myanmar (+322.22% household debt), the Republic of the Congo (+170.08%), Chad (+117.19%), and Lesotho (+101.64%) all saw an increase in household debt of over 100 percent.
You can view the world’s current lowest household debts, such as Ukraine’s, when you sort the map by “Household debt (2018)” and select the “3.07 – 0.63” and “11.21 – 3.38” groups. For now, let’s move on to the highest of a different kind of debt.
Household vs. Government Debts: How Do They Compare?
Now let’s see how public or government debt compares.
Of the countries with the most debt in this category, just one also made the top 10 list in high household debt: Canada. In the country, this amounts to $44,348 per person. Here’s the rest of the top countries by public debt:
- Japan: $102,503 Purchasing power parity (PPP)
- Singapore: $97,852
- Qatar: $77,278
- Greece: $50,562
- Italy: $49,060
- Ireland: $47,822
- Belgium: $47,291
- United States: $46,645
- Canada: $44,348
- Bahrain: $43,659
Japan’s overall debt is clearly the highest. Meanwhile, the United States, which has a National Debt clock in New York City’s Times Square, only comes in 8th overall when it comes to public debt.
Find your own insights on the map above when you group by any date field. Then bring your own data to life with our free mapping tool.
