Drinking Age Across the Globe

In many countries, the age at which you can legally have a drink is seen as a milestone in one’s life. That age has also long been debated. Should the drinking age coincide with a country’s voting age, military draft age, the age at which you may purchase a lottery ticket, or rent a car? Or should it be an age unto itself? The drinking age in the U.S. is 21, although this is not the case in every other country, or even in some states within the U.S. Some countries even prefer not to enact such constraints. The drinking age in Ireland, for example, is nonexistent in a private residence.

View Drinking Age Map in a full screen map

Take a look at the rest of the drinking ages of all the world’s countries on the map above, or read on for more insights.

Most Common Legal Drinking Ages

The most common drinking age around the world may be a bit surprising as it is “none.” Almost half, or 83 out of the 178 countries (47%) on our list do not have any sort of minimum drinking age requirement. However, many of these countries do have a minimum purchase age varying from 14 to 20 years old. In these countries, minors can have a drink in the comfort of their own home at any age, but in public they are restricted. Many of these countries have age specifications on the ABV, or alcohol by volume, as well as the type of alcohol being consumed. For example, in Belgium, beers, wines, and ciders can be purchased at age 16, but spirits are only to be purchased by those over 18 years old. Some countries, like Angola in Africa, have no national law that prohibits the sale of alcohol to minors.

The second most common minimum drinking age is 18 years old. In fact, 35% of the countries on our list follow this rule. The third most common drinking age is listed as “illegal,” and the fourth most common drinking age is 21, just as in the United States. The U.S. is paired with just seven other countries with a drinking age of 21, or four percent, making the U.S. the minority. Believe it or not, the United States is not a one size fits all alcohol policy country. While the U.S. is known for its drinking age of 21, this 21 hard limit is actually not the case for all of the states. The 1984 National Minimum Drinking Age Act withholds money from states that permit under 21-year-olds to purchase alcohol. Before the act went into effect in 1984, each state had its own drinking age, all varying greatly.

However, even after the act went into effect, only a few states specifically prohibited minors from drinking alcohol in private. As of January 2010, there are 15 states that outlaw minor consumption of alcohol in public or private settings and 17 states that don’t have any sort of ban on underage consumption in private. There are 18 states that permit underage drinkers the consumption of alcohol with family or in specific locations. Religious exceptions to the rule pertain to all states.

Nothing (Alcoholic) to Drink Here

There are 11 countries or 6% of our list in which any consumption of alcohol whatsoever is considered breaking the law, and there are some pretty severe punishments that go along with it. All but three of these 11 countries are located in Asia, and many of them are Islamic countries.

In Bangladesh, Saudi Arabia, Yemen, Pakistan, the Maldives, Iran, Afghanistan, and Kuwait, it is illegal to drink alcohol. Most of these countries ban alcohol for religious purposes. For example, in Bangladesh, alcohol is illegal to Muslims but is legal to non-Muslim tourists in private. In Pakistan, non-Muslim citizens may possess alcohol if they are using it in a religious ceremony. In the Maldives, alcohol is legal to tourists over the age of 18, but the sale of alcohol to local Maldivians is punishable by law. Alcohol is illegal in Iran, however, minority religious groups may purchase small amounts of alcohol from shop owners who are of the same minority religion.

Saudi Arabia is one example of a country with severe punishments for the consumption or possession of alcohol. Anyone who drinks or possesses alcohol may be arrested and put on trial. If the accusations of alcohol consumption or possession ring true, the guilty party can be subject to heavy fines, long prison sentences, and even whippings.

In Libya, Somalia, and Sudan, it is illegal to consume any alcoholic beverages. In Libya, this prohibition has led to black markets for the sale of alcohol. Somalia also has implemented very strict laws when it comes to the production of alcohol. This Islamic country bans all alcohol-related activity, including the manufacture, trade, and consumption of alcohol. However, non-Muslims and tourists may consume alcohol in the privacy of their own home. Sudan has prohibited the manufacture, sale, possession, and consumption of alcohol since 1983.

Too Young, or Just Right?

On the flip side, the youngest drinking age on our list belongs to Germany. In Germany, if a 14-year-old is accompanied by a parent or legal guardian, it is legal for them to consume or purchase beer, wine, and cider. Without a parent or legal guardian, you must be 16 years or older in order to consume or purchase the alcohol. However, when it comes to hard liquor, you must be 18 years or older in order to serve, sell or supply. Any violations of these rules may result in a fine of up to 50.000€ or over $60,000.


Regardless of your views on the world’s differing alcohol policies, the map above provides a glimpse into the lives of young adults across the globe. Make your own map like the one above with BatchGeo.

Where the U.S. Guzzles the Most Water

The United States used 354,550.89 millions of gallons of water per day in 2010, and each state and county contributed very different amounts of water to that grand total. Even at the state level, water usage can be as individual as a fingerprint. We turned that individuality up a notch when we mapped the United States’ water usage at the county level.

View County Level Water Usage in a full screen map

The average county’s water usage was just under 110 millions of gallons per day. Curious to see which counties are way over or way under the average water usage, and what they’re using all that H2O for? Read on for details about the water usage of over 3,000 U.S. counties.

You Used How Much to Water the Lawn: Counties with the Highest Domestic Water Usage Per Capita

The domestic water usage is comprised of all the water used for home-related activities such as drinking, showering, watering plants, washing pets, etc. We were curious to see what the numbers would show us when we focused solely on domestic water usage per capita. We narrowed down the data to populations over 500,000 to see which large counties use a whole lot of water.

Interestingly enough, of the counties with populations higher than 500,000 people and high domestic water usage per capita, most are located in the Mountain States areas of Arizona, Nevada, Utah, and Colorado. This is likely because it doesn’t rain much in these Mountain States, so there’s not much help from the skies in the water department for plant watering and such. However, not every single county in the Mountain States uses up so much water. The following five largely populated counties guzzle lots more water domestically per capita than others so they may want to start setting a timer during their showers.

  • Hillsborough County, FL, 498 gallons/day
  • Arapahoe County, CO, 423 gallons/day
  • Clark County, NV, 326 gallons/day
  • Utah County, UT, 321 gallons/day
  • Polk County, FL, 319 gallons/day

Maricopa County in Arizona just narrowly missed the top five with a usage of 313 gallons per day.

We’re not too surprised to see Clark County on this list. The county is home to Las Vegas, where visitors come and use the water without being accounted for population-wise.

Florida counties make multiple appearances in the top five. The only non-mountain state on our list, Florida is a bit of an outlier. However, as you’ll read about later, Florida uses an incredible amount of water. In fact, the Sunshine State is one of the top contributors to the U.S.’s high total water usage.

Model Water Citizens: Counties with the Lowest Domestic Water Usage Per Capita

Now the above list doesn’t mean all U.S. counties are guzzling water in the home at alarming rates. Let’s give those top domestic water using counties something to strive for with the five highly populated counties with the lowest domestic water usage per capita:

  • Summit County, OH, 96 gallons/day
  • Delaware County, PA, 116 gallons/day
  • Allegheny County, PA, 120 gallons/day
  • Montgomery County, PA, 120 gallons/day
  • Jefferson County, KY, 120 gallons/day

While Pennsylvania may be looking impressive now, they seem even more so if we were to expand the top five to the top seven, as they also hold 6th and 7th place.

Guzzle Away: Counties with the Highest Total Water Usage

While we just showed you the highest and lowest domestic water users per capita, we also wanted to expose the highest overall water users. We’ll come to learn that these counties’ high total water usage is mainly due to non-domestic water uses such as thermoelectric power, mining, and irrigation.

The following five counties contributed the largest amount of water to the U.S.’s six-figure a day grand total in 2010:

  • Calvert County, MD, 3,265.38 Mgal/d
  • Los Angeles County, CA, 3,064.01 Mgal/d
  • Salem County, NJ, 3,054.08 Mgal/d
  • San Diego County, CA, 2,818.19 Mgal/d
  • Fresno County, CA, 2,813.24 Mgal/d

Read on to see what they used all those millions of gallons of water for.

Non-Domestic Water Usage

Calvert County, Maryland uses an unbelievable amount of water per day, although its domestic water use is a measly 4.72 Mgal/day or 149 gallons/day per capita. This leaves 3,257.96 Mgal/day in non-domestic water usage to get to its huge total of over 3,000 Mgal/day. We wanted to know what Calvert County was using all of that non-domestic water for, so we mapped the specific non-domestic water usages as well.

View Non-Domestic Water Use Specifics in a full screen map

What we found was that thermoelectric power is responsible for Calvert’s water usage. The county, not home to an extraordinarily large population with 88,737 people, uses about 3,258 millions of gallons per day on thermoelectric power alone. Thermoelectric power uses water to generate electricity through steam turbines in order to burn fossil fuels. And, in fact, thermoelectric power is one of the largest uses of water in the U.S. and in the world. Calvert’s use of thermoelectric power accounts for 99.8% of the county’s water usage, with only 0.1% of water being dedicated to domestic uses and the other 0.1% being used for public supply.

Coincidentally, the third highest total water using county on our list, Salem County, New Jersey, has an identical percentage makeup to that of Calvert County’s water usage. Like Calvert County, 99.8% of Salem County’s water usage goes towards non-domestic uses, such as thermoelectric power. Only 0.1% of Salem County’s water goes towards domestic uses and the final 0.1% is used for public supply.

Of course, we can’t forget about California. In fact, the Golden State has a bit of explaining to do. It’s notable that of the top five counties with the highest total water use, three of the five are counties located in California.

While three California counties are top water users, each county paints a very different picture when you delve deep into their water usage. And each county’s water usage is not exactly what you’d expect by looking at its population size. For example, teeny tiny Fresno, with a population of just 930,450 people, touts some big numbers when we take a closer look at its non-domestic water usage. In fact, the small county has an irrigation water usage of 2,492.77 Mgal/d, which is over 27 times greater than the highly populated L.A. County’s irrigation water usage.

Also of note is Los Angeles County’s mining focus. The county used 94.42 millions of gallons of water per day for mining. That is over 55 times more water than San Diego County used for the same reason, even with a roughly 6 million population difference. As for thermoelectric power, San Diego County beat out the much larger Los Angeles County with their 2,142.35 Mgal/d water usage to L.A.’s 1,361.35 Mgal/d. Fresno’s water usage towards thermoelectric power? A measly 0.62 Mgal/d.

All in all, these top three water using California counties use the majority of their water for non-domestic reasons such as irrigation, livestock, aquaculture, industrial, mining, and thermoelectric power. Los Angeles County uses 53.9% of its water towards these non-domestic purposes, 1.3% for domestic purposes, and 44.8% for its public water supply. San Diego County uses more of its water for non-domestic purposes with 82.3% of its water used non-domestically, 0.7% used for domestic reasons, and 17.1% for Public Supply. Fresno, comparatively, dedicates 90.6% to non-domestic uses, with most going to irrigation, 0.3% for domestic use, and 9.2% for public supply.

Calling out California – and other Top Water Users by State

Of course, when the counties of each state are added up, they show us that some states use way more water than others. Below are the five states with most total county water consumption:

California

Photo by Robert Couse-Baker

The 58 counties of California total a water usage of over 37,962 million gallons per day. That 37,962 Mgal/d stems largely from irrigation to which the state contributes a little bit over 60% of its total water usage. Roughly 17% of the state’s total water usage goes towards thermoelectric power. California’s grand total for non-domestic water use is about 83%.

The state of California alone contributes to 11% of total withdrawals in all of the categories.

Texas

Photo by USDA NRCS Texas

The total water usage of the over 250 Texan counties is 24,796.69 millions of gallons a day. Some 11,120.1 Mgal/d goes to thermoelectric power or nearly 45%. A solid 27.6% goes to irrigation. Altogether, the Texan counties contribute 82.9% of their water to non-domestic usages.

Idaho

The 44 counties in Idaho use 17,230.47 Mgal/d. A whopping 98.2% of that water goes towards non-domestic things such as irrigation (81.5%) and aquaculture (16%).

Florida

The 67 counties of the Sunshine State use 14,935.97 Mgal/d. Florida, much like Texas, dedicates the majority of its water use to thermoelectric power. About 61.5% of its water goes to thermoelectric power to be exact. Irrigation takes up 19.5% of Florida’s massive water use. All in all, 83.4% of Florida’s water goes towards non-domestic related water usage.

California, Texas, Idaho, and Florida’s water usage together make up 25% of the entire United States’ water usage.

Illinois

The 102 counties of Illinois add up to 13,091.30 millions of gallons of water each day. Some 81.8% of that total stems from thermoelectric power. In total, 87.8% of the water used in Illinois each day goes to non-domestic purposes.

Together, the five states of California, Texas, Idaho, Florida, and Illinois account for 30% of the total water usage in the United States.


And there you have it, folks, all of the U.S.’s many counties mapped by water usage. However, if you’re less interested in water and more interested in beer, head on over to Where U.S. Beer is Brewed to see the top 10 U.S. states by brewery count.

Make a Map of Your Retailers or Sellers

The internet has made many things possible without leaving your device. You can order clothes, toys, household goods, and even groceries. Despite these e-commerce conveniences, most of life still takes place in the real world. People browse local shops to touch the merchandise and interact with their community.

There’s still a place for the online world within the offline world. People search the internet to determine where they’ll physically visit. Maps can help connect the virtual and real worlds, as you’ll see as we make a store locator map below.

View Example Map in a full screen map

A map like this is useful if you:

  • Sell products through retailers
  • Run multiple locations of a business
  • Use consignment or other sellers for your products

All you’ll need is the name and address of the physical stores, then you’ll be able to build a Google Maps store locator without code in just in a few clicks.

Organize Contacts in a Spreadsheet

The first thing you need is a list of places you want to map. You may already have this stored in a text file, a CRM, or maybe even on a piece of yellow lined paper. A really good way to store your list of locations is in a spreadsheet.

Create a new spreadsheet in Excel, Google Spreadsheets, or similar tool. Among the column headers you may want include:

  • Store name
  • Address
  • City name
  • State or province name
  • Country name

If you’re already using another tool, you may be able to export them into a spreadsheet format, such as converting a CRM to Excel.

Or start fresh and add the columns you want to track, and add in all your locations. When complete, it will look something like this:

When you have a spreadsheet full of locations, you’ll be ready to create your map.

Make a “Find a Retailer” Map

An Excel or other spreadsheet document is a great way to share data with others. Additionally, you can use it to track and sort your locations or retailers. And when it comes to creating a map, it’s as easy as copy-paste.

From within your spreadsheet program, highlight all your data, including the headers. Use Ctrl+C (Cmd+C on Mac) to copy the data. Then go to the spreadsheet mapping tool on the BatchGeo homepage and put the data in the main box using Ctrl+V (Cmd+V on Mac) to paste.

The video above walks through a basic map, or you can find a full Excel mapping tutorial that walks through step by step.

When you’re done, your map will look something like this:

View Retail Locations in a full screen map

There are only a few locations on this map, but you could have many more. Each row of your spreadsheet will be one marker on your map. Additionally, you can include other data about the location, such as a category of store, inventory, or anything else you’d find useful.

Add Store Type and Other Details

Now that you have a basic map of locations, you can expand the map to include other data. The additional information will be displayed within the box displayed when clicking a marker. You can also use map marker grouping to filter only the markers that match the data.

What sort of data would you use? One common choice is a category or type of store. For example, many companies sell into different types of retailers. A glue gun manufacturer may sell to hardware stores, supermarkets, and craft shops. You could add a column in your spreadsheet for the type of store.

Other fields you could add for the each store include:

  • A description of the store
  • The hours the store is open
  • Phone number(s) for the store
  • Neighborhood or other category-like information

When you have your spreadsheet with the location and other columns of data ready, simply follow the copy-paste instructions above. This time, rather than clicking “Map Now,” you’ll want to “Validate & Set Options.”

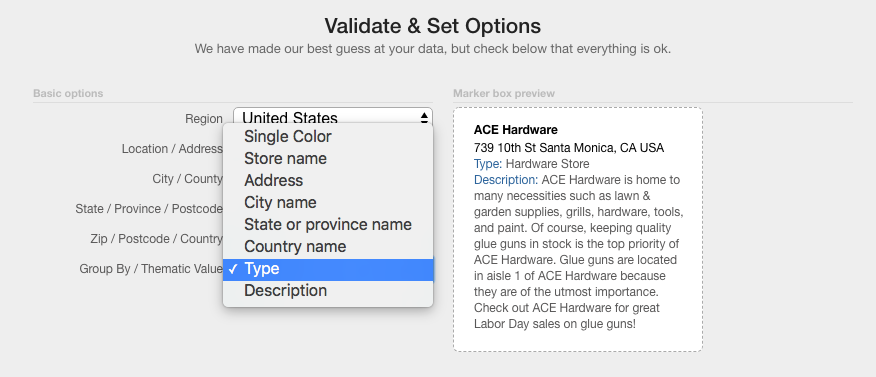
Double check the location columns are correct, then click the “Group By” dropdown to select Type, Category, or similar group-able field. Now you’re ready to click “Make Map” and see a map like this appear:

View Retail Locations with Type in a full screen map

Notice that the store types determine the colors of the markers. You can click the options at the bottom of the map to filter only the types you select. This location browsing can be very useful for you, especially if you have many retailers. It can also be a great service to your customers, so you can help them find their nearest place to buy from you.

Publish the Map on Your Website

Installing a “Find a Retailer” or “Store Locator” on your website adds professional polish. It also helps your best customers buy more from you! Once you have a BatchGeo map created for all your sellers, it’s really easy to add it to your website.

Every time you create a map, you receive an email with a link to edit your map. Also in that email—and on the edit page—you’ll find “Embed Code.” This is some HTML you can use in any website to easily include your map within your existing website.

All you need to do is create a new page or choose an existing retailers page. Then copy-paste the Embed Code to your website.

Add a Search Box

Each BatchGeo map comes with its own search box in the upper right hand corner. You can use it to enter a city, postal code, or full address to search the map for the closest location.

In addition, you can include a search box without a map anywhere on your website. From the same map editing page, choose “Locator Code” and copy-paste that into a single page on your website, or a header/footer template to include it on every page. Let your customers find a retailer or store location from anywhere on your site!

A Map For All Your Data

Now that you’ve created a map of store locations, what other spreadsheets or lists of addresses could you make geographic. Get customers or leads on a map, perform geographic data analysis, or simply map your address book to see where all your friends live.

All you need is a simple spreadsheet with addresses, and we’ll turn that into a useful map. Make your first map today!