Where U.S. Beer is Brewed
Across the United States, we’ve started to describe liquid in colors like straw, deep gold, copper, and red-brown. We even distinguish between light black and dark black—isn’t black just black? Not when you’re describing beer from the thousands of breweries that have sprung up in the last ten years. Microbrews are too big—now there are nano brews, which has quadrupled the breweries nationwide since 2007.
View Breweries by State in a full screen map
On the map above, you see each state, with a marker colored to match its current number of breweries. Click the “2017” in the lower left of the map to change years, or see the 10 and 20-year growth rates. Dig into the details in the map, or see below for the stories we found in the data.
Top 10 US States by Brewery Count
- California (981)
- Washington State (448)
- New York (420)
- Colorado (408)
- Michigan (402)
- Pennsylvania (352)
- Oregon (323)
- Florida (287)
- North Carolina (287)*
- Texas (279)
- * Technically, North Carolina is tied for eighth with Florida.
The most populous state in the country, California also leads the way in breweries. Its 981 is more than numbers two and three combined. That includes New York, the third-most populous state. California’s reign goes back as far as our data does. In 1984, California’s nine breweries accounted for over 20% of all US breweries tracked.
Many states have moved up and down in the rankings in the last 20 years. Colorado was second to California in 1997 and 2007 but slipped down to fourth in 2017. Oregon has also bumped down two notches in the last 10 years. It’s not that they haven’t grown—both states have more than tripled breweries during this time—but that they haven’t grown as fast as others.
New York, for example, climbed into the top three from the eighth spot in 2007. North Carolina jumped into the top 10 with an over 600% growth rate. To make room, others had to leave the top 10. Most notably is the state whose baseball team is called the Brewers. Wisconsin dropped 10 places in 10 years, from the fourth-most breweries in 2007 to #14 in 2017.
Of course, Wisconsinites might argue the state produces a lot of beer, even if its number of breweries haven’t kept up. That’s an important distinction to make. This map, and the data within it, covers individual breweries, not barrels of production. Since 11 brewers make over 90% of US beer, that map might not be quite as interesting.
Interactive Maps Made Easy
Sign Up NowOverall Growth in Breweries
The growth in the number of breweries tells the story of proliferating microbrews. This is a nationwide trend that we see present in just about every state. You’ll see a chart for every state by clicking the marker above it on the map. For example, the one embedded here is California’s. The shape of many of these charts is similar, showing the pattern nationwide. While there was modest growth between 1997 and 2007, the greatest growth has come during the last ten years. In fact, the story becomes even clearer when we look at the national numbers by year instead of by decade.
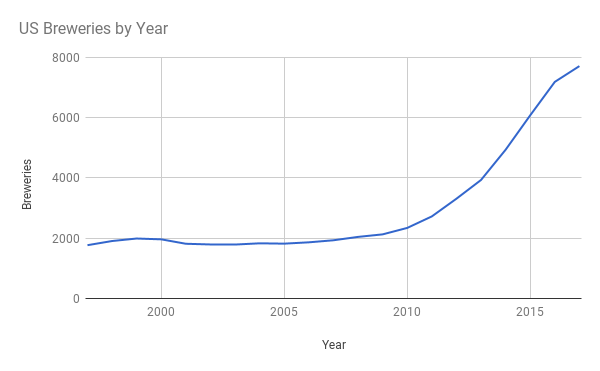
Slight growth at the end of the 20th century turned to decline during the recession of the early 2000s. The number of breweries remained relatively flat until 2009 or 2010, the beginning of the increase that further spiked beginning in 2013.
The apparent recent drop in growth rate is actually due to incomplete data for 2017. The current count of breweries is as of the end of the first quarter, so it is reasonable to expect continued growth. In fact, we’re on pace to add 2,000 new breweries in one year, the first time that’s ever happened. If that pace continues, 2017 will add nearly double the number added in 2016.
Fastest Growing Brewery States
- Arkansas (900%)
- Alabama (740%)
- Virginia (680%)
- North Carolina (637%)
- Texas (620%)
- Florida (574%)
- Indiana (570%)
- North Dakota (566%)
- New York (545%)
- Minnesota (538%)
The growth rates listed above reference the last ten years, the time when most of the brewery growth has happened. As is the case with high percentage growth, many of these states had very few breweries in 2007. Arkansas, for example, had only four breweries in 2007 (the same number it had in 1997). Now Little Rock and Fayetteville lead the way and the entire state boasts 36 breweries. Similarly, Alabama jumped from five in 2007 (down from eight in 1997) to 37 in 2017.
Many on the list started above Arkansas and Alabama’s current levels in 2007, and still grew at rates close to those southern states. New York had 77 breweries in 2007 and now has over 400. Texas and Florida both decreased considerably between 1997 and 2007 but bounced back in a big way thanks to the national trend, now with 279 breweries in the Lone Star State and 287 Sunshine State breweries.
Perhaps most indicative of the nationwide growth is that the slowest growing states still doubled the number of breweries in ten years. Hawaii, with just a dozen breweries in 2007, now has 25. Brew-happy Wisconsin, which lost its spot in the top 10 overall, still added 132 breweries, a growth rate of 226%.
No matter the color of beer you drink, it’s clear that there are more options than ever. And that trend appears to be continuing, with more breweries than ever set to be added this year. So raise a pint of pilsner, porter, or IPA to thousands of US breweries, coast to coast.
