Luckiest Lottery States
Each year, lucky lottery winners score millions—even billions—in prizes. But to win, you must first play by purchasing Powerball and Mega Million tickets.
That leaves us wondering: how much does the average person spend on lottery tickets per year in any given state? And, perhaps more importantly, how much does any given state dole out in prizes each year? You can take a look at that along with the largest lottery jackpots on the map below.
View Luckiest Lottery States in a full screen map
States That Award Billions in Lottery Prizes
In 2017 alone, $46.7257 billion dollars was awarded by the 44 U.S. states that participate in the lottery. Ranging from 4.6 billion to 14.3 million per state, let’s see which 10 states doled out the most in lottery prizes based on the most comprehensive data from 2017.
- New York: $4.6 billion in lottery prizes awarded
- California: $4 billion
- Florida: $4 billion
- Massachusetts: $3.7 billion
- Texas: $3.3 billion
- Georgia: $2.7 billion
- Pennsylvania: $2.6 billion
- Michigan: $2 billion
- New Jersey: $2 billion
- Ohio: $1.9 billion
Each of the states listed above hands out lottery prizes in the billions. But New York takes the cake with 4.6 billion, as no other state awarded more in 2017. The state also tops the charts in total lottery ticket sales with $8.3 billion, nearly double the amount awarded, answering the question of where does the lottery money come from?
Making the 4.6 billion more impressive is N.Y.’s lottery spending per adult. It’s only the fourth highest ($530.72), while median household income is just 14th in the nation at $67,844. The state also isn’t the most populous, having more people to participate—that’s California.
Both California and Florida have awarded four billion in lottery prizes. While the two states tie there, California sees $6.2 billion in sales versus Florida’s $5.8. C.A. is also more populated than the Sunshine State and the median household income differs, as you’ll see on the map. And thus ends the states giving away four billion or more.
The rest of the top 10 resembles a list of the most populated states, although Massachusetts and New Jersey are surprising additions. And even these top 10 aren’t the end of those in the billions. Illinois, North Carolina, Maryland, Virginia, and South Carolina have also awarded that much.
Interactive Maps Made Easy
Sign Up Now
The rest of the states range from $948.3 to $14.3 million in prize money awarded in 2017. Note that Mississippi’s state lottery wasn’t in effect in 2017, while Alabama, Alaska, Hawaii, Nevada, and Utah have no state lottery at the time of writing.
Get more information about top states in Total lottery ticket sales and Lottery spending per adult on the map above. Otherwise, let’s learn about each state’s biggest jackpot.
Each State’s Largest Lottery Jackpots
Hand-in-hand with the states that award the most lottery prizes are the biggest jackpots of each. And while New York gave away the most prize money in total, the state hasn’t had one of the top 10 largest lottery jackpots.
| State | Biggest jackpot: cash value (in millions) | Biggest jackpot: tickets | Biggest jackpot: per ticket (in millions) | Biggest jackpot: game | Biggest jackpot: date |
|---|---|---|---|---|---|
| California | $997.6 | 1 | $997.6 | Powerball | Nov. 7, 2022 |
| Florida | $983.5 | 3 | $327.8 | Powerball | Jan. 13, 2016 |
| Tennessee | $983.5 | 3 | $327.8 | Powerball | Jan. 13, 2016 |
| South Carolina | $877.8 | 1 | $877.8 | Mega Millions | Oct. 23, 2018 |
| Illinois | $780.5 | 1 | $780.5 | Mega Millions | Jul. 29, 2022 |
| Michigan | $776.6 | 1 | $776.6 | Mega Millions | Jan. 22, 2021 |
| Wisconsin | $477.0 | 1 | $477.0 | Powerball | Mar. 27, 2019 |
| Massachusetts | $480.5 | 1 | $480.5 | Powerball | Aug. 23, 2017 |
| Maryland | $546.8 | 1 | $546.8 | Powerball | Jan. 20, 2021 |
| Iowa | $396.2 | 2 | $198.1 | Powerball | Oct. 27, 2018 |
Instead, California’s 2022 Powerball tops the table, not only for one of the largest lottery jackpots in U.S. history, but in the world. The Golden State is followed by Florida and Tennessee with a two-way tie. However, the $1.5864 billion Powerball prize was split three ways (also with California), reducing the take home of each winner significantly.
As for the biggest jackpot per ticket, South Carolina held the record before CA’s 2022 Powerball. The state gave away $877.8 million to one lucky Mega Millions winner back on Oct. 23, 2018. Since then, both Illinois and Michigan have seen more recent large jackpots per ticket: Illinois with $780.5 in 2022 and Michigan with $776.6 in ’21.
Let’s see how we can manipulate the map to gain other insights.
Identify Only the Data You Want
So far, we’ve shared the 10 states that award the most in lottery prizes and the biggest jackpot of each state.
Yet, what if you want to identify the largest lottery jackpots by a certain game? You’re a fan of the Powerball or you’re feeling lucky about Mega Millions—and you want to know the biggest (or smallest) prizes only from that game.
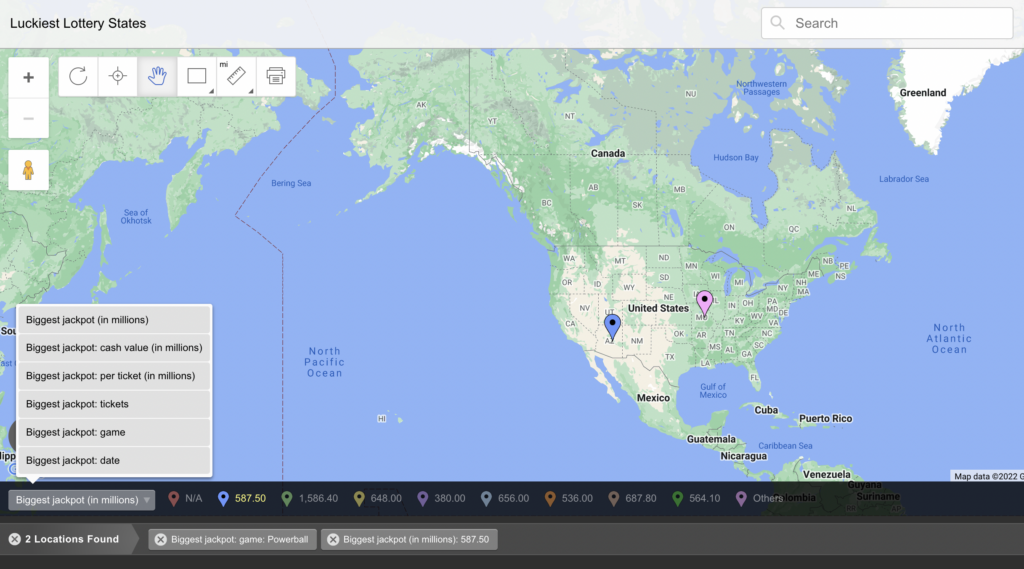
By selecting multiple Group By filters in the lower left of your maps or the maps of others, you can do just that. Multi-Column Grouping and Filtering works on a map of lottery winners along with any map with multiple columns, like Country by Country Life Expectancy or The Fittest Cities in America.
