Google Maps Vector API and Performance Issues
Modern web and mobile apps are an amazing feat: they take thousands of data points from all over the world, mash them together into a cohesive view of a location, and display them to users in a fraction of a second. Most of those interactions are powered by Google and its collection of tools that allow anyone to build Google Maps. That includes its newer vector data maps and the original raster data maps. When there’s a new Google Maps feature, we try to give it a shot. There’s usually a way we can incorporate it into our own maps.
Google’s own maps website provides an excellent web experience. It’s so fast and performant, even when showing a lot of results, multiple routes, and other overlays on top of its base map. We’ve expected they use vector maps, which send pieces of the map to the browser to put together. Our team decided to compare the vector options to get improved performance for our service and users. At least, that’s what we hoped for, but we found a different story altogether.
Since 2006, BatchGeo has pushed to the edge of what’s possible with our custom map tool, built on Google’s platform. Our users have created nearly 20 million maps with their own spreadsheets of data. How quickly these load determines not only their experience but also impacts the people with whom they share the maps. In the past, we’ve benchmarked the fastest geo coders, though that doesn’t show an end user’s experience. In this post, we look at how Google’s vector data performs in comparison to the default raster data. At the end, we’ll give some guidelines to improve performance, which we’ve naturally included in our own map tool.
Wait, Google Supports Vector Maps?
The Google Maps developer tools are numerous. You are forgiven if you haven’t noticed its support for vector maps, especially since the feature has to be explicitly enabled within the dashboard. Though the look is nearly the same as raster maps, vector maps are built in a totally different way. Our hope was to explore new features these maps make possible—but only if we could keep the great performance users expect from our maps.
Interactive Maps Made Easy
Sign Up NowVectors Enable Data Within the Map
The classic Google Maps map is primarily made of markers, the icons added for each location. These usually represent a single specific place, such as an address or landmark. Yet, many times the data is attached to a larger geographic area, such as a state or country. Or, you want to aggregate your data from many points into a region. BatchGeo currently solves these use cases with clustering and grouping. Vector maps could help us do even more.
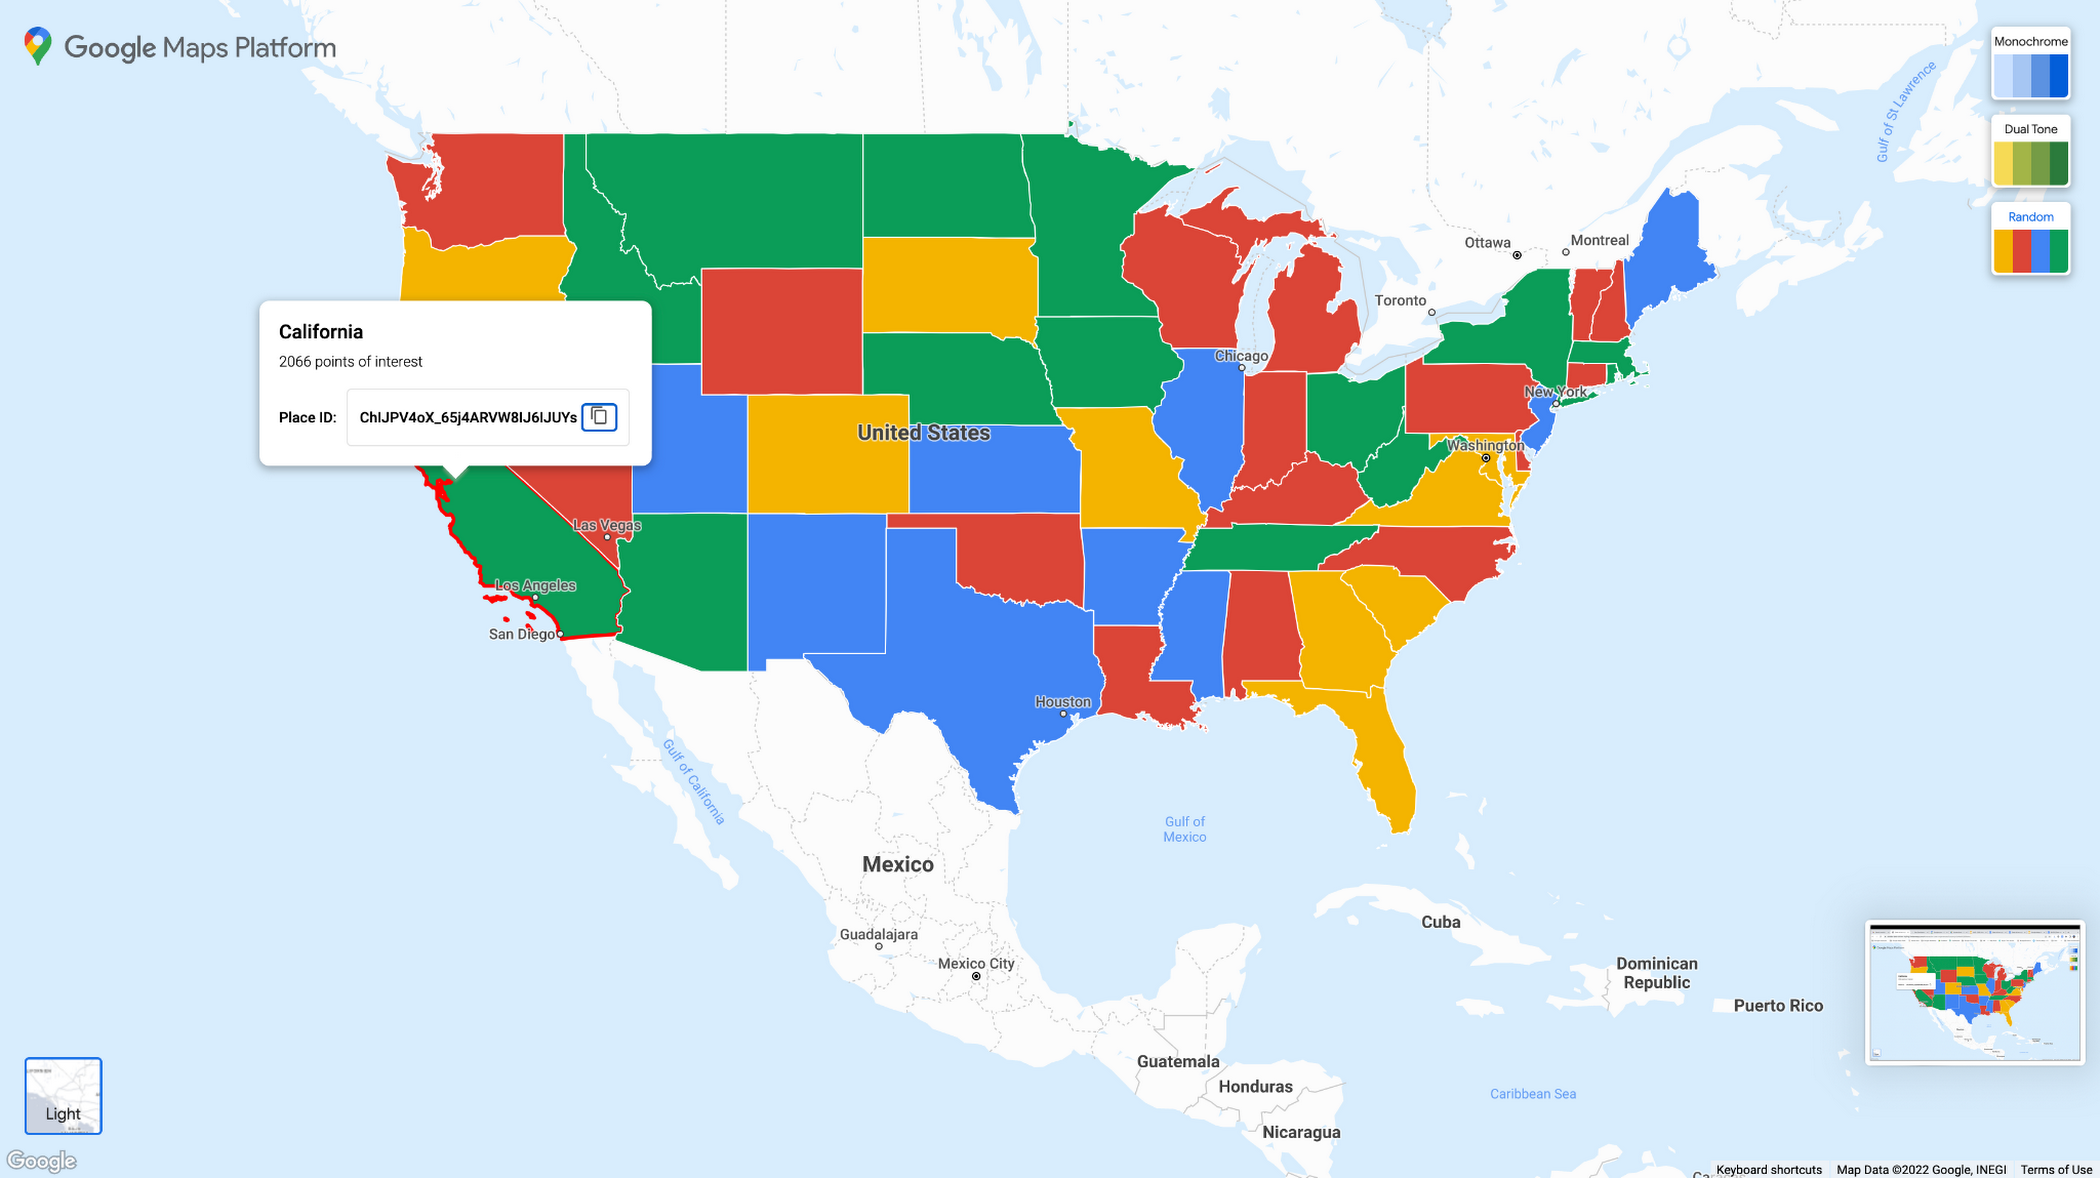
For example, the classic choropleth map like the one above is difficult and inefficient with raster maps. Yet, data-driven styling is built into the vector version of the Google Maps platform. Any boundaries that Google maintains are available to style according to your own data.
Countries, provinces, states, counties, cities, and postal codes are among the areas that can be styled with vector maps. Rather than representing the center of these areas with a single point (as in raster maps), the boundaries can be displayed and adjusted with vector maps.
Vector Maps vs Raster Maps
The reason these new innovative features are available with vector and not raster has to do with how each is built. Vector maps are generated on the user’s machine based on geographic data. By contrast, raster maps are composed of tiled images generated on a server then downloaded by a user.
It’s likely that vector maps appear clearer, especially on newer monitors. Since they aren’t made up of images, they don’t have pixelation and compression issues. In Google Maps, vector data also allows for 3D effects (such as tilt) and more control over what elements are visible on a map.
Advantages of vector maps:
- Potentially smaller download
- Cleaner, clearer images
- Built-in 3D effects
- Greater control of visible elements
- Can include 3D overlays
We were aware that we might see some diminished performance relative to raster maps—how the content is delivered and rendered in the browser is fundamentally different. That said, with all the potential upsides, we were excited to see if vector maps could improve BatchGeo.
Vector Map Test Results
Before we implement a new Google Maps feature, we want to give it a good test. We have users all over the world, with varying connection speeds. One of the most important factors for us is speed, so we wanted to see how vector map performance compares to the raster maps we’ve used traditionally. Since users map their spreadsheet data with BatchGeo, we see lots of markers. Customers of BatchGeo Pro can add up to 25,000 on a single map, so it was important we test the limits of vector map markers.
We created a basic map and ensured it was connected to a vector map:
// set options - keep as simple as possible
const googleMapOptions = {
  center: { lat: -77, lng: -51 },
  zoom: 8,
}
// if in vector map, set the mapId to trigger vector map time if(isVectorView) googleMapOptions.mapId = ‘abc123’ // used actual map ID value
Then we added default markers to the map, a different number for each test. We used the Chrome browser and its time to interactive (TTI) property within the performance insights.
Here’s what we found:
| Map Type | 0 markers | 1000 markers | 5,000 markers | 10,000 markers | 15,000 markers | 25,000 markers |
|---|---|---|---|---|---|---|
| Raster | 0.5 seconds | 0.75 | 0.65 | 0.75 | 0.9 | 1.2 |
| Vector | 1.5 seconds | 2.75 | 10.27 | 20 | Timeout | Timeout |
As you can see, raster maps greatly outperformed vector maps—even without any markers on the map. It took at least three times as long to display a vector map. With 1,000 markers there is a 2.75-second delay, which is a long time, but still usable. At higher marker counts the vector maps are a non-starter without serious improvements in efficiency (which we’ll discuss).
Interactive Maps Made Easy
Sign Up Now
It’s worth noting, our results are machine-dependent because they require hardware acceleration. This feature is typically enabled by default, though many browsers allow users to disable it. For the Google Maps WebGL features (which include vector maps), hardware acceleration is required. Without the feature, maps will revert to raster.
We observed similar timing in the Firefox browser, though it did not timeout at the higher marker counts. However, without the TTI tooling, it’s not an apples-to-apples comparison. Most importantly, the timing was still beyond what a user would wait to experience. Further, even after the initial delay, there are issues browsing the maps.
Why Isn’t the Google Maps API as Good as Google Maps?
The load time test is disappointing because Google Maps itself loads so quickly. Clearly, it’s not only the vector maps that provide the flagship service’s performance. It’s hard to create a direct, quantifiable comparison to the Google Maps website since it likely uses internal services and not the API. The load time wasn’t the only issue we noticed. We can use screen recordings to show some of the issues we noticed—including how these compare to Google Maps itself.
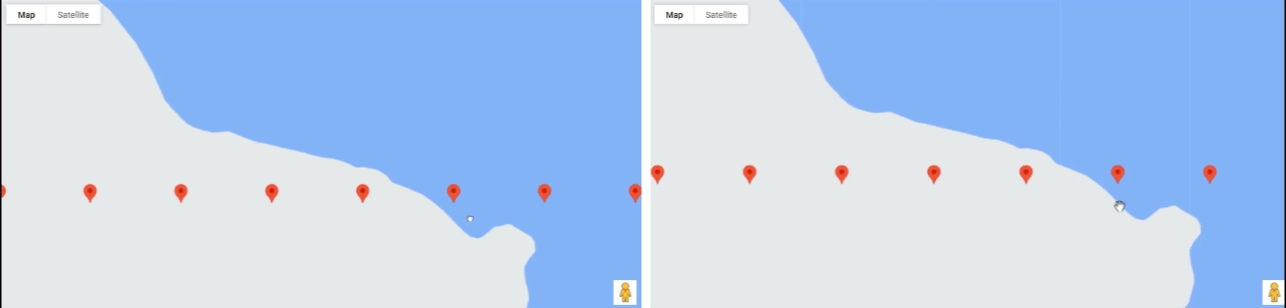
While dragging and zooming maps, both raster and vector versions are “jittery,” especially with more markers. The effect is especially noticeable during zoom events with vector maps, where the jitter can delay as long as a page refresh when marker quantity exceeds 1,000. Again, this is an issue that’s present in raster maps, as well. However, it’s more pronounced with vector maps, as the screen recording above shows. Given the delays we timed for vector maps to add markers, it’s reasonable the same issues cause the jittery dragging.
Notably, we used a very basic map setup for this test. We used a mid-range zoom level, initiated the default vector map, and used standard markers. If there was greater detail needed in the map or it used custom map markers (which we provide on all our maps), the results would likely be worse.
It’s difficult to make a direct comparison to Google Maps itself since we can’t test with the same number of markers. However, we did look at a rapid zoom on a default map.
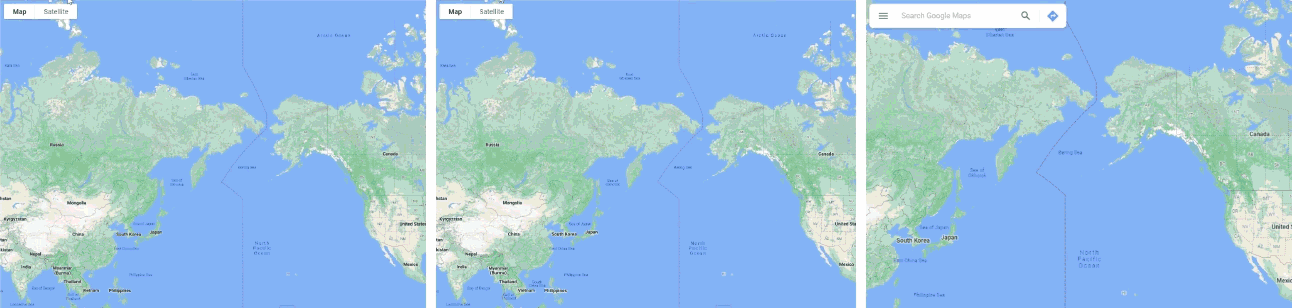
Outside of the initial load, which is not shown, the issues we noticed are less pronounced without markers. Showing data on a map is a key requirement for most Google Maps API projects. It’s the central promise of BatchGeo, where we help users create maps from Excel data without any code. The markers on the map tell the story of the data within your spreadsheets.
In short, our performance conclusion is:
It’s impossible to reproduce Google Maps performance with the company’s API “out-of-the-box,” regardless of whether we use vector or raster maps
Though the performance results aren’t what we’d like, there are some potential ways we could improve our map performance, for both vector and raster maps.
Marker Clustering and Other Performance Tips
Despite the delays and timeouts in our tests of vector maps with a large number of markers, we’ve found some ways to improve the performance of Google Maps. The most obvious solution is to decrease the number of markers shown at any one time. Indeed, there are some ideas below that do this, while keeping the same amount of data visible. But there’s only so much that can be improved, since a vector map with zero markers is already slower than all raster map tests.
Interactive Maps Made Easy
Sign Up NowRecommendation: Don’t Display More Than 1,000 Markers at a Time
A map with 25,000 markers (or even 5,000 markers!) probably doesn’t need to show all markers all the time. You can use MarkerClusterer to display clusters of markers as a single marker with information about the many markers it represents.
At BatchGeo, we automatically cluster large maps and allow users to turn off or on the feature as-needed. Our map clustering feature uses pie charts as cluster icons to represent the underlying data.
Recommendation: Only Plot Markers in Current View
Another way to display fewer markers on the map is to only show what’s visible. You can use the zoom, drag, and pan events to determine the view and what should be on the map at a given time. A related technique would only draw markers when the map is in an idle state. In other words, markers would not be visible while dragging the map, but would be displayed after the drag event is complete.
Indeed, these are part of Google’s own optimization tips for maps, regardless of whether you use raster or vector data.
Recommendation: Be Smart With Custom Overlays
As we’ve seen, drawing many individual markers on the map causes delays. The same can happen with some types of custom visuals. Specifically, we’ve noticed custom markers (whether vector or raster) can add seconds to load time. However, you can improve the performance if you use a different approach. Rather than individual custom icons, add visuals to the map with a custom overlay to help decrease the load time.
Recommendation: Use Frontend Best Practices
Even though Google Maps handles a lot of the difficult geospatial techniques, remember that you’re still building a frontend website. You have other optimizations at your disposal, even if you’ve delegated some to Google. For example, enable performance mode during marker creation in supporting browsers. You can also reduce browser forced Reflow (re-rendering of a page) as much as possible.
Recommendation Recap
That’s a lot of potential improvements and you might not even be the one implementing them. If you’re looking for a simple list of recommendations to pass along, here are two lists based on when you would use the recommendations.
During Map Load:
- Enable performance mode during marker creation in supporting browsers.
- Try not to display/render more than 1000 markers at any given time.
- Use MarkerClusterer as much as possible, if not always.
- Do not use custom marker icons.
- Consider using a custom overlays.
During Map Interaction:
- Reduce browser forced Reflow as much as possible.
- Only plot markers within the current bounds/view.
- Only draw markers or data to the map when the map is in an idle state.
On the other hand, if that seems like too much work, you might prefer a copy-paste map.
Make Maps Easier With BatchGeo
At BatchGeo, we’ve been using Google Maps since the very beginning. If you have geographic data like addresses and postal code in a spreadsheet, you can copy and paste it into our custom mapping tool.
Bring your Excel document of sales leads or Google Sheet of store locations and try BatchGeo for free.
