Author: Adam DuVander

The No Code Custom Google Maps Marker Icons With Colors and Images

These days it’s easier than ever to create a map on the web. For thousands of years maps were difficult and people spent their whole lifetimes exploring and studying to improve their maps. Thankfully you don’t need to set sail for an unknown destination, or even leave your computer, to build a map today. Now there is Google Maps to add a map to your site with a few lines of code, or even no code at all.

One of the things that has made maps easier is that you can build upon a base map chosen by experts. Back in the days of exploration, every map was a new map. That means each map was different than another, but it also meant each map project began anew. By using Google Maps, we can let your map stand out by the data you put upon it via map markers.

This post will show how to further customize your map with different colors, labels, and graphics in your map markers. Even better, most of these examples require absolutely zero code.

Easy Single Color Marker Maps

The most basic map you can have has icons that all are the basic Google Maps marker you’re probably familiar with. It’s an reverse teardrop, reddish icon with a black dot in the center. Like this: Google Maps default marker

We’re looking to create customized markers here, so we’ll toss that guy out the window. It’s still best to have the marker look familiar, such as maintaining the same shape. At a minimum, you want to choose a color that jumps out from the map behind it, so your marker will be recognizable. The map we’ll create in this example will give you customizable choices, while also fulfilling the requirements of a good web map.

  1. The first thing you’ll need is a list of locations you want to map. We’ve found just about everyone has a list of their friends’ addresses, perhaps used to send holiday cards.
  2. If it’s in a spreadsheet, you’re ready to simply copy-paste them into this custom map maker
  3. Paste your data into the box, then click “Validate and set options”
  4. For our simple map, “group by” should be set to “Single Color”
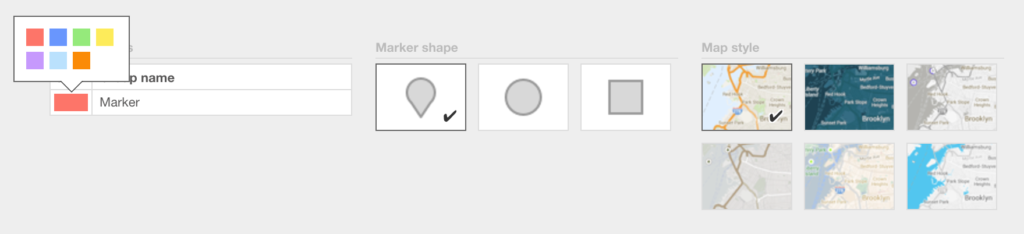
  5. Click “Show Advanced Options” and you’ll see some pretty great customization alternatives
    Custom map options
  6. Click into the existing color to select from the seven color options (10 choices for BatchGeo Pro)

View Holiday Card List (no grouping) in a full screen map

You can also change the type of marker we used. You can see in the map above, I chose orange circle markers. This map looks very different than most that are out there, but is still easily readable and explorable. Once saved (email required to send you a link to make future edits), you’ll be able to link the map to others, or even embed in your own website.

Change Markers Based on Data

The first example showed you how to create a simple custom map. The shape and color of the markers go a long way! Where maps really begin to tell a story is when the markers change based on the other data in the map. The most basic map data may only be a list of addresses. But often, our spreadsheets have many different columns. You may have sales data, home prices, or even restaurant health ratings, to name three examples.

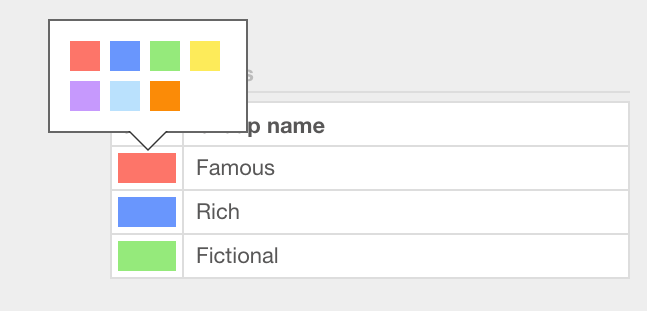
The holiday card list included a “type” column, which we used to describe rich, famous, and fictional friends (we keep strange company). A fun customized map would include a different color to represent each of the three friend types. Let’s do it!

  1. Follow the steps from above to create your map, clicking “Validate and set options”
  2. Here we want the “group by” to be set to “Type”
  3. Click “Show Advanced Options” and this time we’ll be able to select a color for each type of friend
    Multiple marker colors

Now we’re creating a map that is very different than many that would have required you to write a bunch of code.

View Holiday Card List in a full screen map

People using the map can even choose to show only certain types. Click the name in the bottom and the map automatically filters to only the colors/types selected. Using these simple tools, you can create customized, interactive maps that will help others understand the data beneath the map.

Fully Customizable Map Markers (Requires Code)

Changing colors and shapes is great, but sometimes you want something even more custom. If you’d like to change the icon itself, you likely need to write some code. Google has some great examples on its site to get you started. Here’s the basic gist of a custom marker for a Google Map:

var marker = new google.maps.Marker({
  position: new google.maps.LatLng(37.8077333, -122.4750286),
  icon: "http://maps.google.com/mapfiles/ms/micons/truck.png",
  map: map
});

These few lines of code uses JavaScript and the Google Maps API to create a marker object with three attributes:

  1. The position of the marker on the map, declared by latitude and longitude coordinates
  2. A URL to an image you want to use as the icon (find more here)
  3. The pre-existing map object (declared elsewhere in code) where you want to put the icon

You would need to repeat this code for every place you want to add to your map. To do this, you’ll need to have the coordinates for each location. If you don’t have them, you’d need to perform your own geocoding. Finally, you’d need to have your own website to load up this code.

If it sounds advanced, it is. In order to have full customization of a map, this is the only real option for map makers. Unless you’re comfortable in code, or have the time to learn, we’d recommend using one of the non-code options we’ve described.

Other Ways to Customize with BatchGeo

The custom map making tool we showed earlier has some other pretty great features in addition to changing marker shapes and colors. You can also label markers with letters or numbers, which can be used in tandem with the map data, optionally displayed below the map.
https://batchgeo.com/

View Scary Place Names for Halloween in a full screen map

Or simply change the base map itself. There are six map styles to completely change the colors from the typical Google Map. You can see a dark example we used above for the Halloween-themed Frightening Places in the US.

Explore more BatchGeo features or make your first map now.

Going Nuclear: Locations of Nuclear Weapons in the United States and Worldwide

For years after the Cold War, the stockpile of nuclear weapons has decreased. There is renewed interest in the whereabouts of nuclear weapons storage after announcements from leaders in the US and Russia about expanding or updating arsenals. It’s unclear whether either of these powers plan more bombs, though we do know the two continue to lead all other countries on numbers deployed and in storage. But where are those nuclear weapons? In the case of the United States and other nations, we can answer that question.

Nuclear Weapons in the United States

Los Alamos, New Mexico, is famous as the birthplace of the nuclear bomb. The Manhattan Project was housed at Los Alamos Laboratory, where the only bombs used in wartime were built. New Mexico was also home to the first nuclear weapon tests, though no weapons are known to be stored in the state. There are 10 states that are known to store nuclear weapons, as well as other labs and power plants across the country.

View Nuke Facilities in the US in a full screen map

Research by magazine Mother Jones plotted locations on the BatchGeo map above from data released in 2011.

Here are the locations of nuclear weapons in the United States:

  • Naval Base Kitsap (Washington)
  • Malstrom Air Force Base (Montana)
  • Nellis Air Force Base (Nevada)
  • Warren Air Force Base (Colorado and Wyoming)
  • Minot Air Force Base (North Dakota)
  • Pantex plant (Texas)
  • Whiteman Air Force Base (Missouri)
  • Barksdale Air Force Base (Louisiana)
  • Naval Submarine Base (Georgia)

Many of these locations hold warheads awaiting dismantlement. More than half of the potential arsenal is in Amarillo, Texas, at the Pantex plant, which will dismantle them. There do remain some active missile silos, in Montana, North Dakota, and at Warren Air Force Base, which is in both Colorado and Wyoming.

While this data is from 2011, data suggests it’s only decreased slightly during that time. The Bulletin of Atomic Scientists suggests the stockpile in the US fell by 633 between 2009 and 2016, or about 12%.

Nuclear Stockpiles Trended Downwards for 20+ Years

Nuclear Warhead Inventory

Historically, nuclear weapons are at an all time low. The trend downwards began in the mid 1980s, after a rapid increase by Russia during the Cold War. The United States arsenal peaked in 1967, though it wasn’t until the late 1970s that Russia surpassed the US. As the chart shows, all other countries barely register when compared to the United States and Russia.

Despite public gesturing by leaders of both countries, a treaty is still in place to continue decreasing United States and Russian nuclear weapons. The New START (STrategic Arms Reduction Treaty) sets limits for deployed missiles/bombers, deployed warheads, and launchers (deployed or non-deployed). According to the treaty, these limits must be met by early in 2018.

Nuclear Stockpiles Worldwide

View Nuclear Weapons Worldwide in a full screen map

The Federation of American Scientists has compiled the data on many nuclear stockpile locations. Obviously missing from the map above is Russia’s weapons, though we can see some of the US arsenal stored outside of the United States. Additionally, other nuclear countries are shown, including the United Kingdom and Turkey.

Google Maps and GIS Data Demystified

The physical world is a complex place. It’s no wonder that there are so many ways to describe it using geographic data. But that data itself can be quite difficult to understand, with each format a little (or a lot) different from the others. We’ve compiled the most common data file types for GIS and other mapping data. We’ll explain how you would use each type, how you might convert them, and how they help you build a map.

Shapefile: SHP, SHX, DBF, PRJ

Shapefile is a popular format for geographic data originally defined by Esri, the company behind ArcGIS and other GIS software. The singular “shapefile” is a misnomer, as there are actually multiple files needed to describe the geographic data in a shapefile. For every shapefile, at least three files are required:

  • .shp is what gives it the name shapefile and where the geometric features are described, such as lines, points, and polygons.
  • .shx is an index of the .shp file data, compiled into a binary format which makes it easier for applications like ArcGIS to access the data.
  • .dbf is a database format that contains additional data that is not necessarily geographic, such as names/labels for your shapes.

While not required, another common file is .prj, which contains the projection details. This file describes how to convert three dimensional data (i.e., shapes on the earth) to a two dimensional representation.

by Aaron Parecki
by Aaron Parecki

And there’s more. Shapefiles can contain any of these files: .ain, .aih, .atx, .cpg, .ixs, .mxs, .qix, .shp.xml

To read shapefiles, you need software that understands the format. Several Esri products in the ArcGIS suite of desktop software support shapefiles, including the free ArcGIS Explorer. There is also an open source geographic data editor, QGIS, which can read and write shapefiles.

Keyhole Markup: KML, KMZ

Before there was Google Maps, there was Google Earth. And before Google Earth, there was Earth Viewer, made by Keyhole, Inc., later acquired by Google. Earth View became Google Earth, and the Keyhole Markup Language became a popular format for describing geographic data.

by Karl-Ludwig Poggemann

KML, used in .kml files, is an XML-based data format. It’s moderately human readable, since XML is written in plain text. For example, here’s a single point on a map, along with some metadata associated with the location:

<Placemark>
     <name>Paris</name>
     <Point>
          <coordinates>2.3522219,48.856614,0</coordinates>
     </Point>
     <ExtendedData>
       <Data name='Flag'>
       <value>http://upload.wikimedia.org/wikipedia/en/thumb/c/c3/Flag_of_France.svg/23px-Flag_of_France.svg.png</value>
          </Data>
          <Data name='Continent'>
               <value>Europe</value>
          </Data>
  </ExtendedData>
</Placemark>

You can create KML files with BatchGeo that have many locations and can be loaded into Google Earth or other geographic software. In addition to points, KML can include lines and shapes, as well.

Convert KMZ to KML

KMZ files, with the .kmz extension, is a compressed version of KML. It’s a binary format meant to increase the efficiency of sharing KML files, since the size is significantly smaller.

To convert KMZ to KML:

  1. Rename filename.kmz to filename.zip
  2. Decompress the file like you would other ZIP files (usually you can just double click).

After decompressing, you should have a KML file (it may be inside a directory/folder).

GPS formats: GPX, GPI, etc.

A common way to generate geographic data is with a GPS device, such as Garmin, Magellan, or even a smart phone. While the output formats vary greatly, they typically describe points or lines. For individual locations, you may need to save them periodically (sometimes called waypoints). Most commonly, the entire route will be stored as a series of points.

GPX files, with a .gpx extension, is the most common of the many GPS data output formats. Like KML, it is based on XML, so it is text-based markup. GPX can contain both waypoints and tracks/routes. For tracks, there will be multiple points that describe the route. That portion of the GPX file will look something like this:

<trk>
  <name>Golden Gate Bridge Welcome Center to Vista Point</name>
  <number>1</number>
  <trkseg>
  <trkpt lat="37.8077333" lon="-122.4750286">
    <name>TP001</name>
  </trkpt>
  <trkpt lat="37.80771" lon="-122.47502">
    <name>TP002</name>
  </trkpt>
  <trkpt lat="37.8077" lon="-122.47502">
    <name>TP003</name>
  </trkpt>
  ...
  </trkseg>
</trk>

GPX is often used to track and share a certain route, such as a hike or run. It’s also the format accepted by OpenStreetMap, a community that has used GPS traces to create a map of the world.

GPI, with a .gpi extension is a Garmin file format. It’s one of many formats that OpenStreetMap recommends converting to GPX. You can see all the GPS trace formats on the OpenStreetMap site.

Spreadsheets: XLS, CSV

Geographic data may not be the first thing you think of when it comes to spreadsheets and other tabular data formats. That said, a spreadsheet is one of the easiest files to share and remains very human-readable. For that reason, you’ll often find location data stored in Excel, Numbers, Google Sheets, or other spreadsheet formats. Alternatively, spreadsheet-equivalent formats like CSV or tab-delimited files are a way to store data without requiring a specific spreadsheet application. These can typically be imported as a spreadsheet.

Unlike other formats that are specific to geographic data, there is no schema for how locations are stored in spreadsheets. Among the conventions, however, are to have separate columns for levels of data. For example:

  • Address
  • City
  • State of Province
  • Country

These can be turned into geographic data by geocoding the address or location data. Some geocoders require the individual location pieces, while others want a single field.

Other methods of storing geographic data are to store latitude and longitude coordinates directly, usually in two columns.

Map Your Spreadsheets

BatchGeo makes it easy to create a map from your spreadsheets using our mapping tool. Or follow this step by step excel mapping tutorial.