Author: Adam DuVander

The Biggest Hotels in the World on One Map

These hotels better have stock in pillow chocolates. There are over 200 hotels in the world with 1,000 or more rooms. Many of the hotels have even more than that—over 50 of them have 2,000 or more rooms, and 4,000 rooms isn’t even enough to get you in the top 10. That’s a lot of tiny bars of soap!

While the United States leads the way in the number of hotels, Malaysia claims the largest in the world. Macau, Russia, and Thailand join the highest ranks, as well. Over half of the top 10 are in the same city, and you probably won’t be surprised to learn where that is.

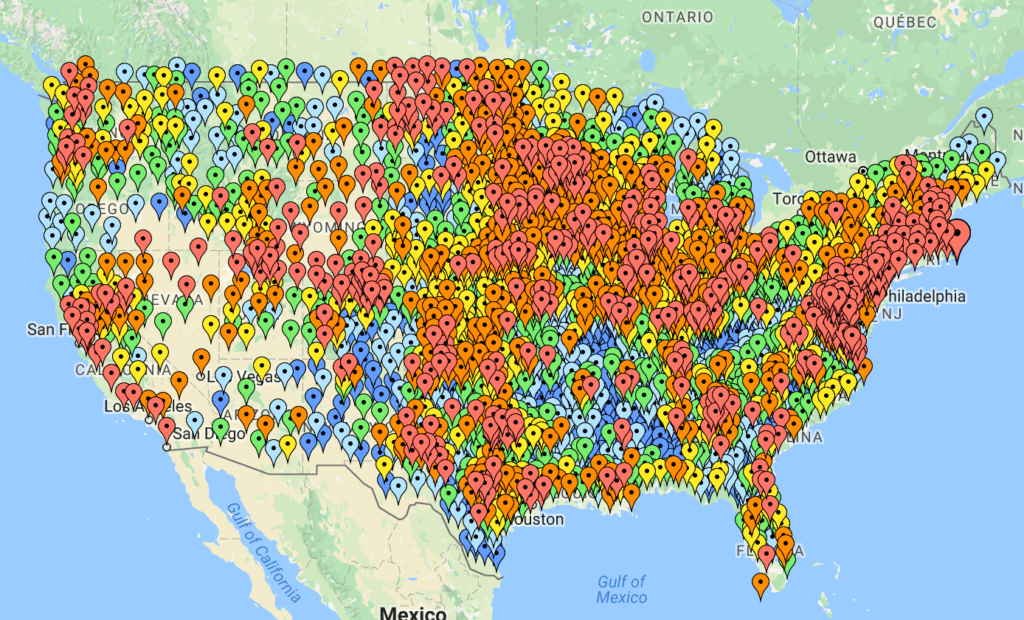
View Biggest Hotels in the World in a full screen map

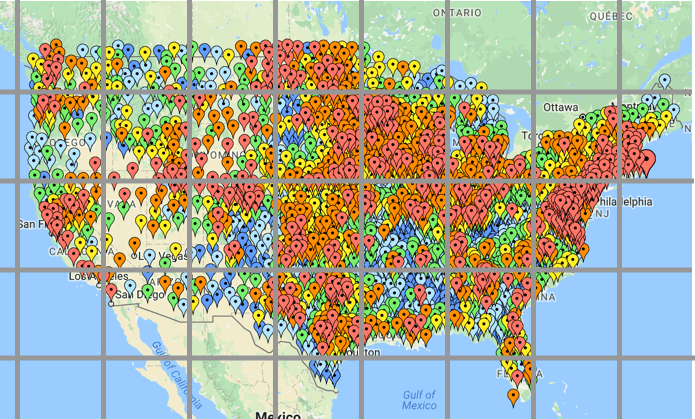
Click around the map, using the grouping functionality, or read on for our assessment of the top 10, countries with the most hotels, and what the biggest hotel rakes in every night when at full capacity.

Top 10 Biggest Hotels in the World

  1. First World Hotel (7,351 rooms), Genting Highlands, Malaysia
  2. The Venetian and The Palazzo (7,117 rooms), Las Vegas, United States
  3. MGM Grand + The Signature (6,852 rooms), Las Vegas, United States
  4. CityCenter (6,790 rooms), Las Vegas, United States
  5. Sands Cotai Central (6,000 rooms), Macau, Macau
  6. Izmailovo Hotel (5,000 rooms), Moscow, Russia
  7. Wynn Las Vegas + Encore Las Vegas (4,750 rooms), Las Vegas, United States
  8. Mandalay Bay + Delano + Four Seasons (4,426 rooms), Las Vegas, United States
  9. Luxor Las Vegas (4,407 rooms), Las Vegas, United States
  10. Ambassador City Jomtien (4,219 rooms), Pattaya, Thailand

Together, these top 10 hotels in the world have 56,912 rooms. At double occupancy, the entire city of Clearwater, Florida, could all go on vacation at these 10 properties at the same time.

First World Hotel

The First World Hotel, number one on the list, has two towers and over 50 stories total. In addition to rooms, the nearly 2 million square foot facility includes a shopping mall and a theme park. If the hotel uses industry standard workloads for its housekeepers, full capacity requires a staff of over 500 just to clean the rooms. Of course, there would be plenty of money to cover those costs: a sold out First World Hotel would be over $700,000 per night if guests paid full price. And that just includes what they spend on the room, not their trips to the cineplex, dining, or casino.

Speaking of casinos, the most popular city for large hotels is clear with a glance through the top 10. Six in the list are in the same “little" city in Nevada. Some of Las Vegas’ most recognizable names are included above, with 32 hotels in all on the map, far more than any other city.

New York City is next on the list of cities with the most high capacity hotels. There are nine hotels on the map in The Big Apple. The largest, the New York Hilton Midtown, has nearly 2,000 rooms across 47 floors.

Disney World is to credit for Lake Buena Vista and Orlando’s many large hotels. Each city has eight. Five other cities have five or more of the biggest hotels: Atlantic City (7), Chicago (7), Macau (6), Mecca (6), and Reno (5).

Countries With the Most Large Hotels

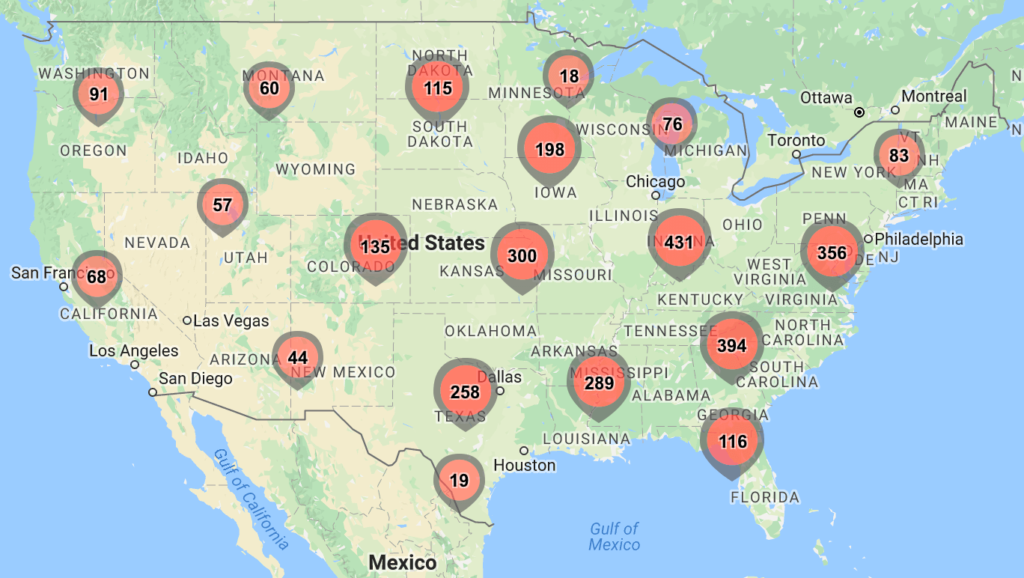
Nearly two-thirds (139) of the 209 hotels in the world with 1,000 or more rooms are in the United States. The map may make that clear, showing nearly half of the 50 states represented. However, the map also shows the remaining 70 large hotels are spread throughout the rest of the world. Five continents have large hotels—South America and Antarctica don’t make the cut.

There are 13 countries that have three or more high capacity hotels:

  • United States (139), total capacity 263,739
  • Saudi Arabia (7), total capacity 9,665
  • Macau (6), total capacity 20,401
  • Russia (5), total capacity 10,738
  • Japan (5), total capacity 8,368
  • France (5), total capacity 5,134
  • China (4), total capacity 6,525
  • Canada (4), total capacity 5,338
  • Thailand (3), total capacity 6,879
  • Singapore (3), total capacity 4,873
  • United Arab Emirates (3), total capacity 4,157
  • United Kingdom (3), total capacity 3,710
  • Germany (3), total capacity 3,145

The total capacity, of course, only includes the hotels with over 1,000 rooms. (That is, Germany obviously has more than 3,145 rooms in the entire country when you include its many lower capacity hotels). Nevertheless, the 190 hotels represented in these 13 countries together include over 350,000 rooms. If each of those rooms had a minibar, those small refrigerators would take up more than half of a Panamax container ship. Imagine all that expensive booze!

A whole lot of insights can fit in a single map. Why not create your map today?

How to Cluster Map Markers: Demo and Tutorial

Maps are a great way to show location data. The stories within the numbers appear when you can see them geographically. It might seem natural that the more points you add to a map the better story it tells, but that’s not always the case. Ideally you could summarize the underlying data, which requires map clustering technology. There are several ways to convert hundreds of markers into a reasonable number that still share the underlying story underneath. The approaches vary in effort and programming ability required, but all can bring even more understanding to your geographic data.

End Marker Overload

Marker Overload

We’ve all probably seen web maps like this. There are so many markers on that map, you can’t even see the map. The colors of the markers tell some kind of story, but there’s so much overlap with other icons that you might well just be missing other data.

A map with fewer markers allows the viewer to take in the information, rather than being overwhelmed. The way marker clustering works is that it provides a summary marker that gives you an idea of what’s “below” at closer zoom levels. Typically, you click a clustered marker to automatically zoom into an area with either additional clustered markers or individual markers. The viewer is able to see just enough at each stage to make sense of where to click to investigate further.

Gridded clustering to reduce Marker Overload

One way of creating clustered markers is to overlay a grid, as in the example above. Though, usually a visible grid is not used. Instead, the grid is defined by latitude and longitude coordinates to evenly segment the area of the map currently in view. Then, any markers within a particular grid are removed and replaced by a single marker, often labeled with the number of markers beneath.

Markers clustered

Above is one example of how a clustered map might look. In that example, the meaning of the color is removed in favor of the number of markers. However, you’ll see in the next section an alternative method that keeps that data visible within the clusters.

Copy-Paste Map Clusters

The easiest way to make web maps is to paste spreadsheet data into BatchGeo. You can include addresses, city names, or other location data, which get converted automatically into latitude and longitude coordinates. There are also several clustering options built into the service, which means you can get data-rich, readable maps in minutes.

Marker clustering showing averages

Let’s say you have a spreadsheet with the average household income of every county in the United States. That’s actually the exact example of marker overload from the previous section. At over 3,000 counties to display, the map looks very crowded without clusters. Here’s how to make a much simpler map that better communicates the meaning of the data.

  1. Copy and paste your spreadsheet into the map making tool
  2. Click Validate and Set Options, then Advanced Options
  3. Click Enabled clustering for high density markers
  4. Select the new option to choose average and Median Income (or whatever your data example)
  5. Finally, click Make Map


The result will be a map like this, with the average of the Median Income values for each county in a cluster displayed as the label.

View Household income, average clustering in a full screen map

You can also get a much simpler cluster that merely counts the number of markers below each cluster. To achieve this basic clustering, just skip step 4 in the instructions below. You can see this example on the BatchGeo marker clustering page, along with sum clustering, which adds up all values in a cluster, rather than averaging.

If these examples don’t suit what you need, you’ll likely need to dig in and write a little code yourself, though you may still be able to copy-paste some of it.

Use MarkerClusterer Library

Google Maps is essentially a standard on the web now. It’s everywhere, used by sites big and small. In fact, it’s the foundation of the BatchGeo example above. Though, when you make Google Maps yourself, you’ll need to write the code to perform some of the fancier bits.

Google provides an open source library to help turn existing Google Maps with markers into a clustered map. While you’ll need some programming background, you can find map tutorials on Google’s site. We can’t go into detail in this post about programming Google Maps, but we’ll show enough to see how the MarkerClusterer works.

The short version is that instead of making a marker like this:

var marker = new google.maps.Marker({
  position: {lat: 37.8077333, lng: -122.4750286},
  map: map
});

You add all markers to a clusterer, like this:

var marker1 = new google.maps.Marker({
  position: {lat: 37.8077333, lng: -122.4750286}
});
var marker2 = new google.maps.Marker({
  position: {lat: 37.9077333, lng: -122.5750286}
});
// Continue creating markers like above...
var markers = [marker1, marker2]; // add additional markers to the array if you have them
var markerCluster = new MarkerClusterer(map, markers);

So, instead of including the map variable in each marker, you pass map and an array of markers to the MarkerClusterer, which creates the clusters if necessary.

You’ll also notice that to create Google Maps, you must know the latitude and longitude coordinates. If you don’t already have those for your locations, you’ll need to use a geocoder to convert your addresses (and other location values) into coordinates.

Despite requiring code, using the MarkerClusterer is about as simple as you can get when building Google Maps yourself. If this is too much work, we recommend the copy-paste option above, which provides a lot of advanced mapping in a very simple approach.

However, if you want to dig even deeper, you’ll probably be writing your own clustering algorithm, or building off of other open source technology.

Write Your Own Clustering

This option is the most customizable, but obviously requires some significant coding skills. Since there are hundreds of different directions this could take, we won’t go into details here, but instead give a few resources to consider:

  • Leaflet is an open source library used by the most hardcore of web mappers
  • Leaflet.markercluster is a clustering plugin for Leaflet
  • Anycluster is server-side clustering for use with Geodjango

These and more can be found in this GitHub search for those comfortable with code.

For all others, we recommend checking out our spreadsheet to map tool right now. It’s free and has clustering built in.

Energy Production Worldwide: Who Leads in Oil, Coal, and Natural Gas?

We can thank electricity for many things, including that you’re reading this page right now. In fact, there’s a good chance the device you’ve used to access this site is running on energy created by oil, coal, natural gas, or uranium. (A small percentage of you may live in a windmill, or have a hand crank charger). Transportation, manufacturing, and most industries count on continued energy production. That varies by country, of course. Some are rich in natural resources that leads to one or more of these major energy sources. And a few are rich in most or all of them, as you’ll see on the map and in the analysis below.

View Oil, Coal, Natural Gas, and Uranium World Leaders in a full screen map

Like all BatchGeo maps, you can interact with the map markers to see the underlying data. Another powerful way to understand the data beneath is to use the grouping and filtering feature to find trends. By default, we’re showing the Rank Average, which takes a non-weighted sum of each country’s rank. For example, the United States is ranked third in oil, second in coal, first in natural gas, and ninth in uranium. That country’s ranked average is 3.75.

Top 10 Countries By Energy Production

Top energy producers

  1. Russia (#1 in oil)
  2. United States (#1 in natural gas)
  3. China (#1 in coal)
  4. Canada (#2 in uranium)
  5. Kazakhstan (#1 in uranium)
  6. Australia (#3 in uranium)
  7. India (#3 in coal)
  8. Brazil (#10 in oil)
  9. Ukraine (#10 in uranium)
  10. Romania (#14 in uranium)

If we eliminated uranium, Indonesia would not only be in the top 10, but climb to fifth in the rankings. The southeast Asian nation is #5 in coal production and #11 for natural gas. Other specialized energy producers that don’t make the overall top 10 are:

  • Saudi Arabia (#2 in oil)
  • Iran (#3 in natural gas, #6 in oil)
  • Iraq (#4 in oil)
  • Qatar (#5 in natural gas)

Perhaps unsurprisingly, those Middle Eastern nations are so rich in oil and natural gas, they don’t rank as high with coal or uranium. We’ll see them all again in the next section.

Top 10 Oil-Producing Countries

When we think of energy production, oil is the first thing that springs to mind for many. Here are the top 10 by number of barrels produced per day.

Russian oil field

  1. Russia (10,250,000)
  2. Saudi Arabia (10,050,000)
  3. United States (8,744,000)
  4. Iraq (4,836,000)
  5. China (3,938,000)
  6. Iran (3,920,000)
  7. Canada (3,652,000)
  8. United Arab Emirates (3,188,000)
  9. Kuwait (3,000,000)
  10. Brazil (2,624,000)

As mentioned previously—and you’ve likely anticipated—the Middle East covers half of the top 10. However, Russia narrowly edged out Saudi Arabia for the top spot, based on 2016 numbers. The U.S. rounds out the top three, followed by Iraq and China.

A couple surprising entrants in the top 10 are Canada and Brazil, both countries large in size. Canada, for example, is second only to Russia in square miles, but is 38th in population.

Top 10 Coal-Producing Countries

If you considered the popularity of energy sources by the frequency they’re written about in the news, coal would likely be second to oil. Here are the top 10 coal producers by million tonnes.

Pile of coal in China

  1. China (3,747)
  2. United States (812.8)
  3. India (677.5)
  4. Australia (484.5)
  5. Indonesia (392)
  6. Russia (373.3)
  7. South Africa (252.1)
  8. Germany (184.3)
  9. Poland (135.5)
  10. Kazakhstan (106.5)

The U.S. (#2) could quadruple its production and still be second to China’s incredible coal production. This is the only category where the overall leader, Russia (#6), drops out of the top five, an order of magnitude behind China.

Top 10 Natural Gas-Producing Countries

Like oil and coal, natural gas is a fossil fuel. However, as the name states, it is a gas. By contrast, oil is a liquid and coal is a solid. Due to already being in a purer form, natural gas burns much cleaner than its fellow fossil fuels. Here are the top 10 natural gas producers by billion cubic meters.

Natural gas well in the United States

  1. United States (728.2)
  2. Russia (578.7)
  3. Iran (255.5)
  4. Canada (143.1)
  5. Qatar (133.2)
  6. Norway (114.7)
  7. China (107.2)
  8. Saudi Arabia (103.2)
  9. Algeria (82.76)
  10. Netherlands (80.78)

The only category where the U.S. is number one, natural gas has historically been most prominent in the southwest and up through Wyoming and Colorado. Fracking technology has led to Pennsylvania and West Virginia being large producers in the last 10 years.

Again, the Middle East has a strong showing. Iran ranks higher in natural gas production than oil. Qatar, Norway, Algeria, and the Netherlands all make the top 10 in natural gas, but did not make the same list for oil. The closest is Norway at 13th and the lowest is Netherlands, 51st on the oil producers list.

What is a “Cubic Meter” of Gas?

As you might imagine, measuring a gas is more difficult than a liquid or solid. Temperature and pressurization both have an effect on how much gas fits into a cubic meter. Therefore, there are international standards governed by the International Energy Agency. When measuring the volume of natural gas, it must be at 15 °C (59 °F) at atmospheric pressure.

Top 10 Uranium-Producing Countries

The least popular of the four energy sources we’ve covered, nuclear power has a checkered past. From concerns about nuclear weapons powers to catastrophic meltdowns that cause issues for generations, uranium production is not as common as the others. That said, the top three countries overall each make an appearance in these top 10 countries by tonnes of uranium.

Power plant in Kazakhstan

  1. Kazakhstan (23,800)
  2. Canada (13,325)
  3. Australia (5,654)
  4. Niger (4,116)
  5. Russia (3,055)
  6. Namibia (2,993)
  7. Uzbekistan (2,385)
  8. China (1,616)
  9. United States (1,256)
  10. Ukraine (1,200)

At almost two times China’s production, Kazakhstan leads the way. The former Soviet country is both a major exporter, as well as having one of the largest reserves. The country is also a major producer of fossil fuels, which puts it fifth overall. In fact, only three of the top 10 uranium producers don’t make the top 10 overall: Niger, Namibia, and Uzbekistan.

Create a Map of World Leaders

Plotting data on a map is one of the best ways to understand the story in the numbers. Find a table of data on Wikipedia or a government website, and it could be mapped with a simple copy and paste. We show details in our open data mapping tutorial.

Already have some data in mind? Create a map now.