We’re Gonna Need a Bigger Map: 125 Years of Global Shark Attacks
Hollywood has long been inspired by sharks. The release of Jaws in 1975 did more than just create a blockbuster, it sparked a cultural phenomenon. Many films have followed in its wake, ranging from the absurdist comedy of Sharknado to the prehistoric spectacle of The Meg.
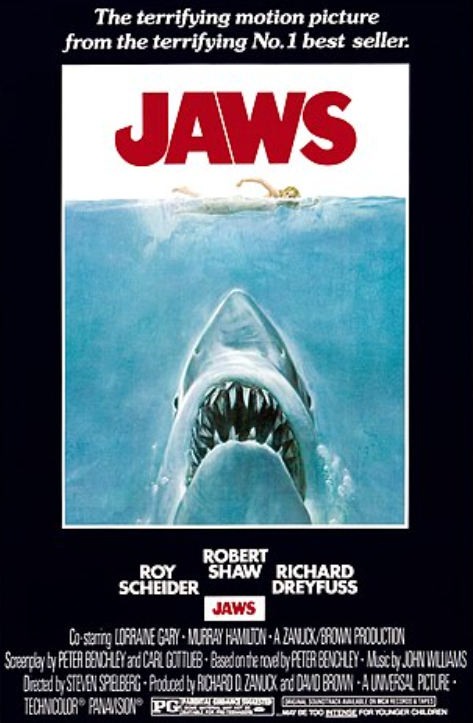
[Source: Jaws Movie Poster by Roger Kastel – Wikipedia]
But somewhere between Hollywood’s version and the actual ocean, there’s a more interesting story: 125 years of documented shark encounters, plotted on a map, revealing where these moments actually occur and with what frequency often.
About the Data
The map below draws from the Global Shark Attack File, maintained by the Shark Research Institute, covering more than 6,000 incidents from 1900 through 2025. Systematic tracking didn’t begin until 1958, so earlier records rely heavily on newspaper archives and explorer logs. Each pin represents a recorded encounter across every ocean-facing coastline on the planet.
View full screen map
Two Attacks That Changed Everything
Before the spreadsheets, there were the stories. Two incidents, decades apart, did more to shape public fear of sharks than any dataset ever could.
The 1916 Jersey Shore Attacks
Over 12 days during the summer of 1916, attacks along the New Jersey coast killed four people and injured one. The incidents included a shocking strike in a freshwater creek in Matawan, upending the scientific consensus that sharks posed little real threat to humans.
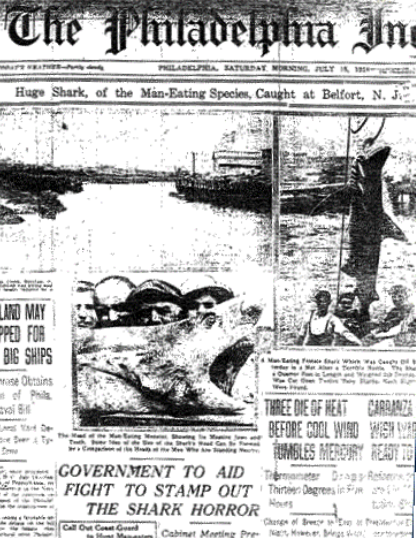
Beach attendance dropped sharply, shark hunts swept the Eastern Seaboard, and the episode ultimately inspired Peter Benchley’s novel Jaws.
The Sinking of the USS Indianapolis
On July 30, 1945, the USS Indianapolis was struck by Japanese torpedoes and sank in just 12 minutes. The ship had just completed a top-secret mission to deliver enriched uranium and other components for the Little Boy atomic bomb later dropped on Hiroshima. Of the roughly 900 men who survived the sinking, only 316 were rescued four days later.
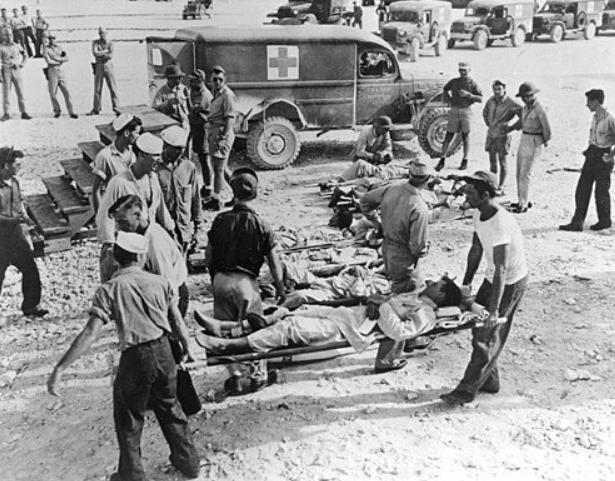
[Source: Wikipedia]
The Discovery Channel’s 2007 Shark Week documentary Ocean of Fear investigated what happened. Its conclusion was that most deaths resulted from dehydration, exposure, and injuries from the sinking itself, with sharks primarily scavenging the dead. Even so, estimates suggest sharks killed somewhere between a few dozen and 150 sailors, making it the deadliest shark attack in recorded history.
Interactive Maps Made Easy
Sign Up NowBoth incidents appear in the dataset behind this map, separated by nearly 30 years and an ocean, but connected by the outsized role they played in shaping public fear of sharks.
What the Data Shows
Not every shark encounter is the same. Of the 6,275 incidents mapped, 4,641 are classified as unprovoked, meaning the shark initiated contact without human involvement. Provoked incidents, where the human drew first blood, account for 607 cases. The remaining records cover watercraft strikes, sea disasters, and other incidents that couldn’t be fully verified.
About 18% of all incidents, or 1,150, were fatal. That figure shifts when you look at it by country. Australia leads all nations in fatalities with 263, despite recording fewer incidents than the United States. The U.S. recorded 167 fatal incidents, followed by South Africa with 96. The gap between total incidents and fatalities suggests that where an attack happens matters just as much as how often.
The United States leads all countries in total incidents with 2,416, followed by Australia (1,353) and South Africa (567). Within the U.S., Florida accounts for 1,161 incidents, more than any other state by a wide margin. Hawaii and California follow at 320 and 317. Perhaps surprisingly, Italy rounds out the top 10 with 62 incidents, a reminder that shark encounters aren’t limited to the world’s famous surf destinations.
Where and When
Incidents were relatively low through the mid-20th century, a reflection of the limits of early record-keeping as much as anything else. From the 1950s onward, as both ocean recreation and reporting improved, incidents climbed steadily. The 2010s recorded the most incidents of any decade at 1,245, with 2015 and 2017 topping the list at 140 incidents each.
Create Your Own Map
Shark attack data is just one example of how a long historical record looks completely different when viewed geographically. Patterns that are invisible in a spreadsheet become clear on a map. Whether you’re mapping historical data, customer locations, or anything in between, BatchGeo makes it simple to turn any dataset into an interactive map.

#/media/File:Jaws_movie_poster.jpg)
#/media/File:USS_Indianapolis-survivors_on_Guam.jpg)