3 Ways to Style Your Interactive Map
It used to be that you had no control over how your map looked. Sure, you could add some markers, but the underlying look of the map was one-size-fits-all. Now you can have a choice of how your map looks, both in the shape and color of a marker, and the colors within the base map. In this post, we’ll share three different ways to style your map. The complexity varies, from the point-and-click simplicity of our custom map creator to alternatives that require code.
Google Maps
Let’s start with the obvious one. Google Maps is the de facto standard way to create a map for the web. The Google Maps API, used by programmers to tap into the functionality of the search giant’s geographic data, is over ten years old. Those with familiarity coding find the features robust, but it’s making a Google Map is complicated to the novice.
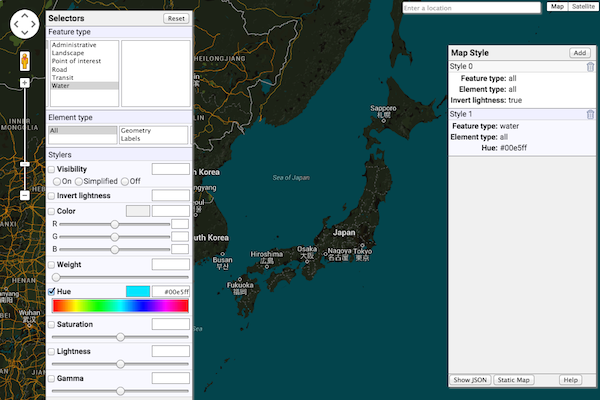
That said, the process of creating a stylesheet for a Google Map is easy. There’s even a wizard that you can use to preview changes. You can browse the selectors available for styling, use a color picker to find just the right hue, and adjust visibility. Google makes plenty of decisions for you, so you aren’t able to do everything you might want. You can’t change visibility of features by zoom level—you get the defaults that Google sets up. You also cannot add any layers that are not always on the map.
Still, Google remains popular. Indeed, it’s what the BatchGeo platform runs upon.
MapBox
If you’re an advanced user who likes lots of options, you’ll love MapBox. This geo startup is flexible enough to allow any data you want to be incorporated into to your map. If you’re a GIS expert (and that might help), you can import your Shapefiles and style them to your heart’s content.
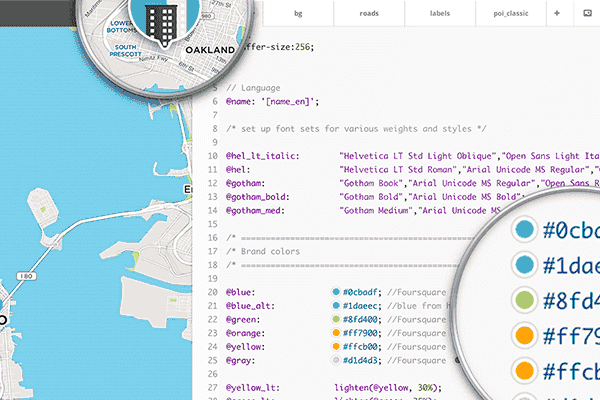
Due to its complexity, the full MapBox editor is only available as a downloadable application. By default MapBox uses OpenStreetMap data, so you have a starting place. You can style those base layers, add and style your own, and adjust much more than with Google Maps—including fonts and textures.
Interactive Maps Made Easy
Sign Up NowThe end result is your own map tiles that MapBox serves to its own JavaScript library, Leaflet, or other map delivery product. You still need to write the code to interact with the map (as you do with Google Maps), but the customization is unrivaled.
BatchGeo
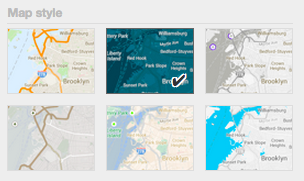 We love maps and enjoy seeing all the different types that people can make. But we also believe maps should be simple to make—like copy and paste from your Excel spreadsheet simple. To balance customization and simplicity, BatchGeo pre-populates six map styles. Add to that three different marker styles in seven colors (10 colors for Pro accounts) and there are many ways to to have your map stand out from all the rest without a lot of effort on your part.
We used the Google Maps styler to create the six styles, one of which is shown in the above map. Our grouping feature automatically creates marker colors based on your data, and the clustering feature summarizes data below high density markers. In many cases, BatchGeo is all you need, and will save you hours of coding (or even having to learn).
Not every project fits into the presets we’ve selected. You may have an idea that requires advanced coding, your own GIS data, and fine-grained control over how elements of the map are displayed. But if you’re looking to display a list of locations on a map without learning to code, we invite you to try BatchGeo now.
