Category: mapping

Biggest Boomtowns of Every U.S. State

There are many prosperous places across the United States. The most successful of these are called boomtowns, a.k.a. the fastest-growing cities in America. What factors determine whether a city reaches “boomtown” status? It all boils down to rapid population growth and increases in housing occupancy. The U.S.’s biggest boomtown has seen a five-year population increase more than 20 times the national average. We’ll give you a hint: the biggest boomtown is located in the state of Washington and it’s within driving distance of a major Washington city. Nearly 30% of all boomtowns in the U.S. are just miles away from a major city. However, not all boomtowns are created equal. While each state’s fastest-growing city is noted, several are seeing only minor population and housing occupancy increases. Some boomtowns are even facing negative population and housing growth. Find out more about the biggest boomtowns of every U.S. state on the map below.

View Biggest Boomtowns in a full screen map

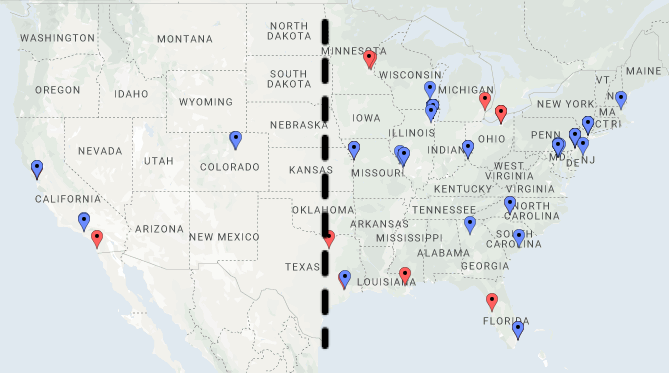
The map contains data from GOBankingRates which they pulled from the U.S. Census Bureau’s 2007, 2012, and 2017 surveys. There are four groupable options on the map: both five- and ten-year changes in population and changes in owner-occupied housing units over five and 10 years.

Biggest Short & Long-Term Population Boomtowns

Short-Term Population Growth

The biggest boomtown of all is Kirkland, Washington. The U.S.’s fastest-growing city has seen a five-year population increase of 76.8%. That’s more than 20 times the national average (3.84%) and more than 39% greater than the next greatest increasing boomtown of Four Corners, Florida. Four Corners is the second-fastest-growing city in the U.S. with a 37.8% population growth also over a five year period. One percentage point lower than Four Corners is Enterprise, Nevada’s five-year population change. The city is increasing by 37.7%.

Kirkland, Washington

Of course, everything is bigger in Texas, including boomtowns. The U.S.’s fourth-largest boomtown is Conroe, Texas, which has a five-year population increase of 34.30%. Conroe is the last of the shorter-term boomtowns to increase 30% or over. The rest of the boomtowns are all seeing population growth of 28% or lower.

Long-Term Population Growth

While Kirkland, Washington beat out every other boomtown in five-year population growth, other boomtowns rise to the top when it comes to ten-year population increases. Given 10 years, several cities are bearing witness to more than 100% population growth. These cities include Waldorf, Maryland (183.30% population growth) Enterprise, Nevada (138.20% growth), and San Luis, Arizona (104.20%). The national ten-year increase is just 7.45%, so these towns clearly are boomin’.

Kirkland, Washington is down to the fourth-fastest-growing city given 10 years’ time with an increase of 89.9% during a decade. Tied for fourth with Kirkland is Wentzville, Missouri which also has an 89.9% increase in population over 10 years. There are seven other notable boomtowns with ten-year population growths of well-over 50%. These include:

  • Mount Juliet, Tennessee
  • Newnan, Georgia
  • Four Corners, Florida
  • Conroe, Texas
  • South Jordan, Utah
  • West Fargo, North Dakota
  • Meridian, Idaho

Boomtowns Next To Boomin’ Cities

When looking at the map, you may notice that many boomtowns are located next to the states’ largest cities. For example, Kirkland, Washington looks pretty close to Seattle, which is the state’s biggest city. Our digital measuring tape confirms this; Kirkland is just eight miles from Seattle. With this in mind, Kirkland’s status as the biggest boomtown makes a whole lot of sense. Those looking for big-city living at a smaller city price may set up residence in Kirkland but easily commute to Seattle for work and a better nightlight. This is a trend that many boomtowns seem to follow.

Our measuring tool points out that Hillsboro, Oregon’s biggest boomtown, is only ten or so miles away from Oregon’s largest city: Portland. The same can be said for the boomtown of Enterprise, Nevada, which is around 12 miles away from Las Vegas. Texas’s boomtown, Conroe, is roughly 40 miles outside of Houston while Oswego, Illinois is 40 miles away from Chicago. Kansas’s fastest-growing city of Overland Park is right next to Kansas City and Carmel, Indiana is close to Indianapolis. Then there’s Mount Juliet, which is Tennessee’s biggest boomtown. Mount Juliet is located right by Nashville.

If you still don’t believe this is a trend, we’ve got many more examples. The boomtown of Newnan, Georgia, is right outside of Atlanta. Four Corners, Florida is close to Orlando while Ann Arbour, Michigan is near Detroit. South Carolina’s Mount Pleasant boomtown is remarkably close to Charleston, as is Massachuttet’s Somerville to Boston. And Waldorf, Maryland is just outside of Washington D.C. Boom, an explosive trend! These cities better watch out. If the populations of these cities continue to grow at the current rate, Kirkland is going to become the new Seattle and Four Corners the new Orlando.

Least Booming Boomtowns

We’re not really sure why Lewiston, Maine is on the list. With a five-year population change of -1% and a ten-year change of -4.20% (yes, you read that right, growth in the negatives) Lewiston is not necessarily what we’ve come to expect of a boomtown. But every state needs a boomtown, and apparently, Lewiston is Maine’s booming-est, although it’s the least booming on our list.

Providence, Rhode Island may be better than Lewiston when it comes to population growth (its at least a positive percentage) but when it comes to Providence’s five and ten-year change in owner-occupied housing units, there are nothing but negative numbers. Burlington, Vermont’s owner-occupied housing growth is also on the decline. Though this boomtown is experiencing a 0.5% population increase over five years and a 10% growth over 10 years, the city faces a -7.90% housing decline over five years -5.90% over 10 years.

Dover, New Hampshire, and Newark, Delaware are the only other boomtowns with negative growth rates. While Dover’s housing is positively increasing over five years, going back further brings this boomtown into a deficit of -1%. Newark, on the other hand, has a better ten-year housing growth of 9.90%. However, their five-year housing growth of Neward is -2.60%.


What qualifies one city as a boomtown could qualify another as an empty, desolate, sad little ghost town. Kirkland is currently the biggest boomtown, but Lewiston could turn it around in the next five years. We’ll check back in with you then.

All we know for sure is that boomtowns certainly vary in their boomy-ness, just as the cost of living in 388 cities worldwide varies. Before you up and move somewhere, note that the cost of living varies around with world. In fact, living in several Swiss cities can be 30% more expensive than living in N.Y.C., one of the most expensive in the U.S.

Presidential Nominating Convention Locations Since 1832

The 2020 presidential race has already begun, which means it will soon be time for two more presidential nominating conventions: the Democratic National Convention and the Republican National Convention. During the conventions, which are hosted in various places across the country, the two major political parties select a candidate for President of the United States. Throughout history, nominating conventions have taken place in 19 different states, 27 different cities, and over different 60 buildings. Find out which cities and buildings have hosted multiple conventions and which states have yet to host even one convention when you continue reading about the presidential nominating convention locations since 1832.

View Presidential Nominating Conventions in a full screen map

As the map above notes, presidential nominating conventions can take place as early as April and as late as Septemeber, though the majority take place in June. These conventions can last anywhere from three to five days. More important than the dates, though, the map shows the locations of every major presidential nominating convention since 1832 and the trends that come with the data.

Cities That Have Seen Many Conventions

The following five cities have hosted more nominating conventions than any other city in the U.S.:

  • Chicago
  • Baltimore
  • Philadelphia
  • New York City
  • St. Louis

Chicago, Illinois has been the destination of 25 presidential nominating conventions. Eleven of those conventions were for the Democratic party while 14 were for Republicans. Baltimore, Maryland is the city that has seen the second-most presidential nominating conventions (10), nine of which were for the blue party. Philadelphia has hosted nine presidential nominating conventions, six of which were for the Republican party. New Yorkers have been privy to six conventions in their city, the majority of which (five) were for the Democrats.

St. Louis, Missouri has seen five total conventions, four being for Republicans. Cincinnati, Cleveland, Kansas City, and Miami Beach have also hosted their fair share of conventions: three each. A slew of other cities have done so twice. In total, the Democrats’ 49 presidential nominating conventions since 1832 have only taken place in 18 different cities. For all of the Republicans’ 42 nominating conventions, they’ve only visited 19 distinct cities.

Same Cities, Different Dates

There have been several election cycles where the Dems and the Republicans held their conventions in the same city, or even, the same building (on different dates, of course). This political feat first occurred in preparation for the 1884 election. June 3-6 Republicans met at the Exposition Hall located in Chicago. July 8–11 that same year, Democrats got together at the Interstate Exposition Building, also in Chicago.

Then came the election of 1932: the year the two major parties decided to save some money by putting down a deposit on the same space. On June 14th, 1932, Republicans got together at the Chicago Stadium to nominate their candidate. On June 27th that same year, Democrats gathered at the same Chicago Stadium for their convention. It happened again in 1944 when the two major parties once again held their nominating conventions at the Chicago Stadium. The two parties seemed to enjoy being in the same space months apart as in the next election (1948), they both held their conventions at Philadelphia’s Convention Hall. It happened again during the next election of 1952 at the International Amphitheater in Chicago. The last time Democrats and Republicans held their conventions in the same space was in 1972 when both parties met at the Miami Beach Convention Center for their respective conventions, one in early July and one in late August.

If the Buildings Could Talk: Buildings With the Most Conventions

1916 Republican National Convention at the Chicago Coliseum

While 25 nominating conventions took place in Chicago, they didn’t all occur in the same space. The Windy City hosted conventions at ten different buildings, with the Chicago Coliseum hosting most frequently.

The Chicago Coliseum is one of only two buildings in the U.S. to host six presidential nominating conventions. Chicago’s International Amphitheatre and the Chicago Stadium, both no longer standing, hosted five conventions. Wigwam, the Interstate Exposition Building, The Amphitheatre, Crosby’s Opera House, Exposition Hall, Auditorium Theatre, and the United Center also hosted conventions in Chicago. The other #1 building that has hosted the most conventions is the aptly named Convention Hall located in Philadelphia, which, like the Chicago Coliseum, has hosted six conventions.

Then there are the buildings each major party prefers. For example, Democrats have held their nominating conventions most often at Madison Square Garden (four times). The blue party also gravitates towards Philadelphia’s Convention Hall as they’ve gathered there three times, along with the Chicago Stadium and Chicago’s International Amphitheatre. Other than these four locations, Democrats don’t tend to host their conventions in the same buildings multiple times. Thirty-six buildings have only held Democratic conventions one time.

Republicans, on the other hand, are more likely to repeatedly hold their nominating conventions in the same buildings. They’ve set up shop most often at the Chicago Coliseum (five times), had three conventions at Philadelphia’s Convention Hall, and have been to each of the following twice: Exposition Hall, Public Auditorium, Chicago Stadium, International Amphitheatre, Cow Palace, and the Miami Beach Convention Center.

Where Could & Should They Convene Next?

The 2020 presidential nominating convention locations have already been selected. For the first time, Democrats will venture to Milwaukie, Wisconsin while Republicans will gather in Charlotte, North Carolina for the second time in history. Even modern-day conventions are following a trend that began in 1832: most nominating conventions take place in the Eastern U.S.

This trend is different from the many instances the West has taken the cake, like the most extreme high and low temperatures in the U.S., and the NBA finals wins per team and opportunity. The one thing Democrats and Republicans seem to have in common is that they tend to miss the entire west side of the nation when picking convention locations.

Aside from California and Colorado, there are no other Western states that have hosted a nominating convention. So, to help out future presidential nominating convention planners, we made a list of the 31 states that have yet to see a convention, most of which are in the West:

  1. Alabama
  2. Alaska
  3. Arizona
  4. Arkansas
  5. Connecticut
  6. Delaware
  7. Hawaii
  8. Idaho
  9. Indiana
  10. Iowa
  11. Kansas
  12. Kentucky
  13. Maine
  14. Mississippi
  15. Montana
  16. Nebraska
  17. Nevada
  18. New Hampshire
  19. New Mexico
  20. North Dakota
  21. Oklahoma
  22. Oregon
  23. Rhode Island
  24. South Dakota
  25. Tennessee
  26. Utah
  27. Vermont
  28. Virginia
  29. Washington
  30. West Virginia
  31. Wyoming

Home State Conventions

If you found yourself wondering if any presidential or vice-presidential candidate had their nominating convention in their home state, we have the answer. Since 1832, only five presidential candidates were nominated at a convention that took place in their home state. These candidates were Abraham Lincoln of Illinois, Horatio Seymour of New York, Rutherford B. Hayes of Ohio, John W. Davis of New York, and George H. W. Bush of Texas.

Occurring even less are the four V.P.’s who were chosen as possible second-in-command in their home state. These candidates were John A. Logan of Illinois, Adlai Stevenson I of Illinois, and George H. W. Bush of Texas when he was nominated to be Vice President.


Now you know all the cities and buildings that have held major party presidential nominating conventions since 1832. Plus, you’re aware of where Democrats and Republicans could and should go next. While we wait to see where future conventions will take place, check out our other president-related maps like the many international travels of U.S. presidents or presidential assassination attempts mapped and the births and burials of U.S. presidents.


Cost of Living in 388 Cities Worldwide

Choosing a retiring destination or city you want to move to is a big step. Before you up and move to a place with the lowest unemployment rate or other benefits, note that the cost of living varies around with world. Take Switzerland for example. There are several Swiss cities that are almost 30% more expensive to live in than New York City (one of the most expensive in the U.S.) There are many other cities where the cost of living is notably higher than average. On the other hand, there are also cities where the cost of living is low. Plus, there are pairs of cities that while geographically faraway, are closer than you think when it comes to nearly identical costs of living. Find out all this and more as you keep on reading about the cost of living in 388 cities worldwide.

View Cost of Living in 388 Cities in a full screen map

The map above shows Numbeo’s list of the cost of living for 388 cities collected on June 27, 2019. While the list is ever-fluctuating, you’ll be able to see which cities are generally the most expensive when you sort by the highest cost of living range. The map also contains more information than the cost of living for each of these cities. In fact, there are multiple indices of interest.

Cost of Living: Indices Explained

Information about rent, groceries, restaurant prices, and local purchasing power are included on the map. The main cost of living index takes into account groceries, restaurants, transportation, and utilities, though it doesn’t include rent. That’s what the cost of living plus rent index is for. As for the local purchasing power, this describes the ability to buy goods and services based on the average wage in the city.

It’s important to note that New York City serves as the baseline for each city. As you’ll find on the map, the Big Apple gets 100’s across the board. Each index is subsequently compared to New York. For example, if Guatemala City’s cost of living is 44.23, it means that on average, Guatemala City is 55% cheaper to live in than New York. As with the cost of living, if a city’s local purchasing power is 41.92, as it is in Guatemala City, the inhabitants of that city with the average salary can afford to buy 58% fewer goods and services than New York City residents with an average salary.

Cities with the Highest and Lowest Cost of Living

With all that in mind, here are ten cities with the highest cost of living:

  1. Basel, Switzerland
  2. Zurich, Switzerland
  3. Lausanne, Switzerland
  4. Geneva, Switzerland
  5. Bern, Switzerland
  6. Stavanger, Norway
  7. Oslo, Norway
  8. Trondheim, Norway
  9. New York, NY, United States
  10. Bergen, Norway
Photo of Bern, Switzerland by Louis from Pexels

If this list looks familiar, it’s because the ten most expensive cities to live in mirrors the ten most expensive cities to spend Valentine’s Day. Swiss cities cost a lot of cash and Basel, Zurich, Lausanne, Geneva, and Bern make up 50% of the top ten list of the highest costs of living. Basel is the highest.

After the Swiss cities, the cost of living faces a steep decline. Stavanger, Norway, the 6th most expensive city, has a cost of living of 105.21, a nearly 15-point drop from #5. Like Switzerland, Norway monopolizes much of the top ten cities with the highest cost of living. Cities ranked #6, #7, #8, and #10 on the list are in Norway. And the U.S. makes its first appearance with the ninth city with the highest cost of living and the baseline for the rest of the world: New York. We mentioned #10 on the list belonged to Norway. Bergen happens to have the exact same cost of living as New York: 100. However, Bergen’s rent index is 37.11, and its cost of living plus rent is nearly 30% cheaper than N.Y. so it isn’t all the same.

As with the commute times and transportation rates within the U.S., we’re forever comparing Los Angeles to New York. You can’t just not compare two of the largest cities on opposite ends of the country. Though L.A. doesn’t appear in the top ten, the City of Angels is ranked #42. The average cost of living in L.A. is 20% less than living in New York. In fact, everything from rent to groceries and restaurants will cost you less in L.A. Los Angeles residents also have a higher purchasing power. Your hard-earned cash has 15% more power in L.A. when compared to N.Y.C.

Lowest Cost of Living

The ten cities where the cost of living is the lowest are all located in India or Pakistan:

  • Rawalpindi, Pakistan
  • Karachi, Pakistan
  • Thiruvananthapuram, India
  • Visakhapatnam, India
  • Islamabad, Pakistan
  • Lahore, Pakistan
  • Vijayawada, India
  • Kochi, India
  • Mysore, India
  • Bhubaneswar, India

Rawalpindi and Karachi are the least expensive cities to live in with respective cost of livings of 17.17 and 19.73. That means that living in Rawalpindi is nearly 83% cheaper than it would cost to live in New York City. However, there may be a downside to cheaper costs of living: houses could be worth little in these cities. India has six cities on this list, the cheapest of which is Thiruvananthapuram, which has a cost of living of 20.41.

While not the lowest of the low, the major cities of South America make for another interesting trend. The majority of South American cities have costs of living on the lower side, ranging between 54.29-41.76.

Distant Cities with Duplicate Costs of Living

Image by edar from Pixabay

We’ve discussed the cities with the highest cost of living and those with the lowest, but what about the cities with the nearly identical cost of livings? No, it’s not Basel, Zurich, Lausanne, Geneva, or Bern, Switzerland. The following cities are on opposite sides of the globe, yet though they are distant, they have duplicate costs of living. Aalborg, Denmark, and Tokyo, Japan have nearly identical costs of living despite being over 8,500 miles from each other. Aalborg’s cost of living is 90.28 while Tokyo’s is just .02 less at 90.26. A different Danish city has a similar cost of living as Boston, Massachusetts. Arhus, DK has a cost of living of 86.92 while Boston’s is 86.87. That’s only a .05 difference.

Now for the “thruple:” Dublin, Ireland, Sydney, Australia, and Singapore. The costs of living in these three cities are all within less than .2 of each other. Dublin cost of living is 79.61, followed by Sydney’s which is 79.52, and Singapore’s cost of living which is 79.4. And even though Paris, France is only officially a twin city with Rome, when it comes to cost of living, Paris is nearly identical — fraternal twins if you will — to Seattle, Washington. Though these two cities are 4,993 miles apart, their costs of living are only .09 away from each other. The cost of living in Paris is 85.91 while Seattle’s is 85.82. In case you were wondering, Rome’s cost of living is 71.08 which is nowhere near Paris’s. Seattle: 1; Rome: 0.

We found nine nearly identical costs of living between very distant cities. How many more can you find? There are lots of cities that are so close — in cost — yet so far away in distance. To calculate the distances between cities with similar costs of living on the map, just break out the digital measuring tape. BatchGeo’s Advanced Mode allows you to select the measuring tool (ruler icon in the top left corner of the map.) You can either click on the first option and drag your cursor from one location to another to see the distance between the two points, or you can nmeasure a boatload of distances from one point all at once by clicking on the multi-measure tool.


Well, we’re off to move to a nice moderately-priced city like Valencia, Spain (cost of living: 54.76), Ljubljana, Slovenia (cost of living: 55.82), or pretty much any city in Europe, aside from Switzerland, of course. The map showed us that the majority of the average-costing cities can be found in Europe. Maps like this one really illuminate data trends, so be sure to check out related maps you can make in minutes, including how to apartment hunting visually with a custom map, how to make an open house map, and how to visualize local crime data with a map.