Show Wikipedia Images on a Google Map
Compared to spreadsheets, maps are better at visualizing your information and helping you make sense of your data’s geography. Yet, even the most customized map doesn’t always tell the whole story.
You can give your location markers more context by going beyond textual information — we’re talking about incorporating images. After all, a picture is worth 1,000 words.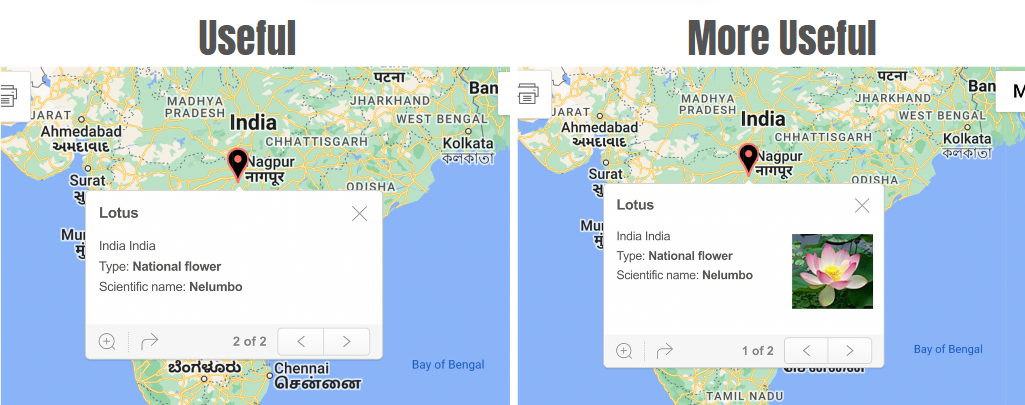
BatchGeo is already the easiest way to map your spreadsheet data. If images are part of that information, BatchGeo maps can display those, too. And while there are many places to find free-to-use photos, nothing beats Wikipedia for images.
The Best Wikipedia Pages Have Tables and Images
To level up your map, start by finding some images. Since we’re focusing on images from Wikipedia, we’ll start there.
Pop your topic into a Google search bar. While Wikipedia may organically top the results, you can further filter your search by adding “site:Wikipedia.org.”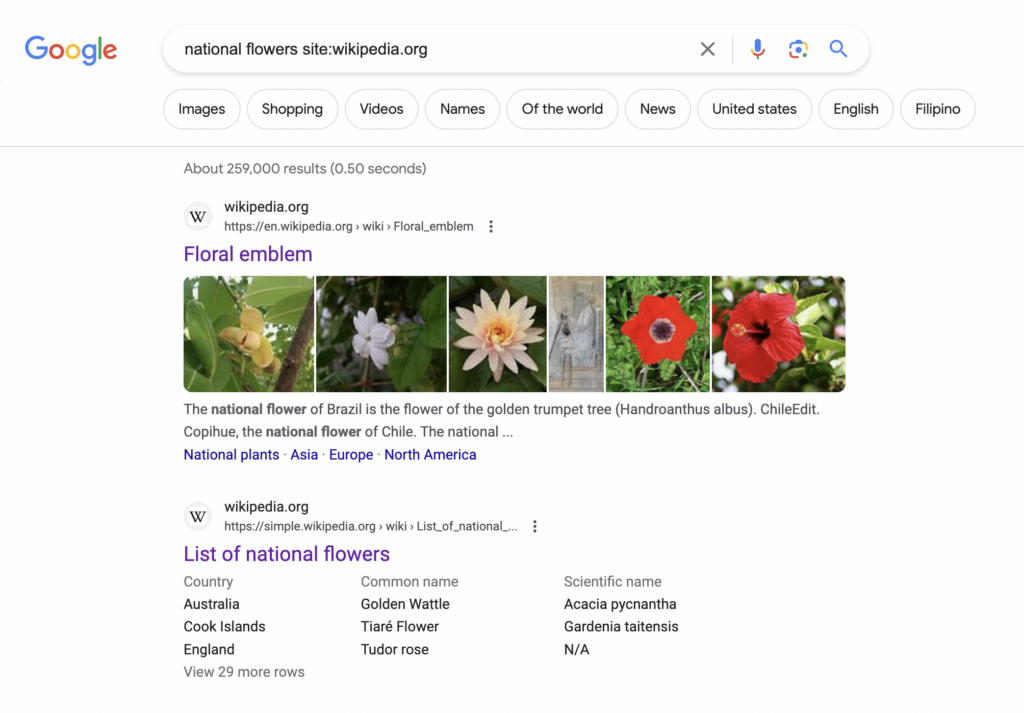
You will likely see quite a few options. Those starting with “List of” will be your best bets, as these Wikipedia pages often contain images as well as text. 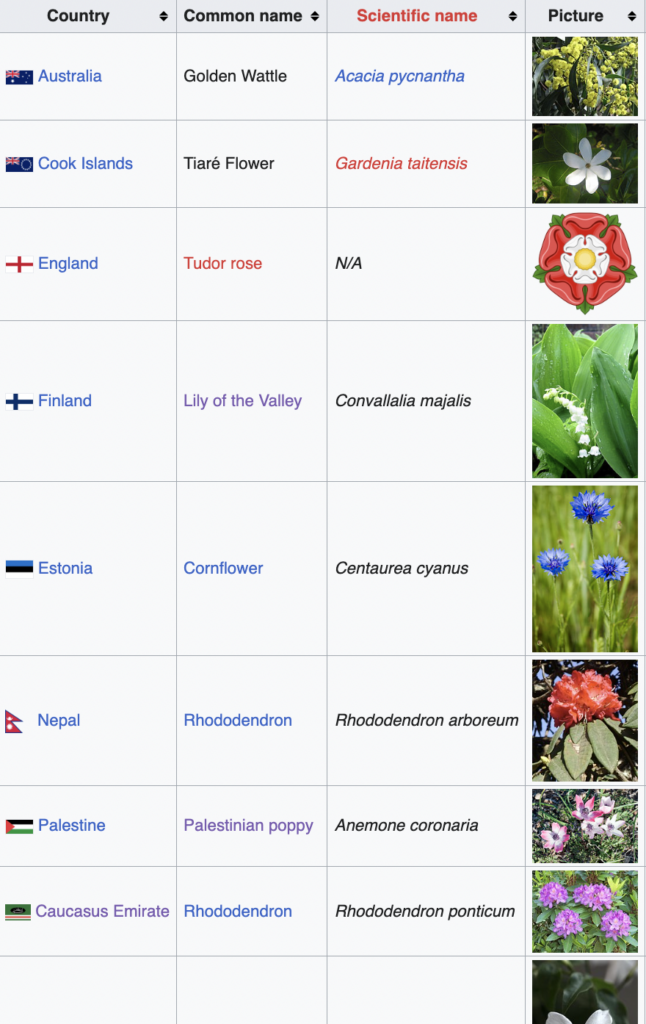
Automatically Capture Wikipedia Table and Image Data
While Wikitables make copying and pasting the data into a spreadsheet easier than the alternative, you still don’t want to manually do so for rows and columns of information, including the image links. Instead, you can use a tool that automatically grabs the data for you to paste into your spreadsheet while maintaining the table format from Wikipedia.
We recommend the Table Capture browser extension in Chrome. Here’s how to use it:
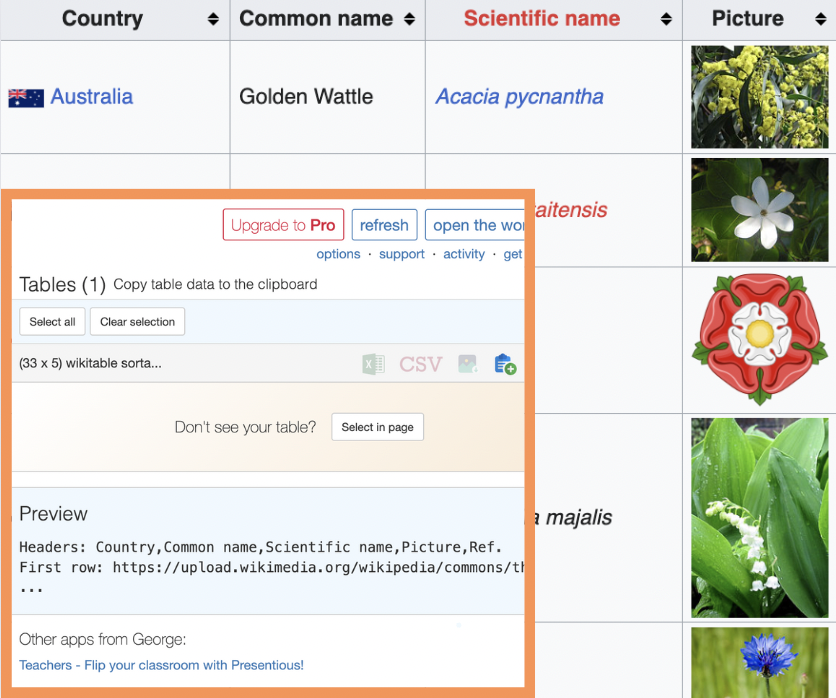
- Add the Table Capture extension to your Google Chrome browser.
- Because we want to pull in images, click the extension in the upper right corner of your browser and choose “Options.”
- In the “Options” tab, check “Extract Image and Icon Attributes” and make sure “Ignore Images Completely” is unchecked.
- Hit “Save.”
- Navigate to the Wikipedia page where you want to pull a data table.
- Once again, click on the Table Capture extension.
- Select your desired table(s).
- Click the icon representing the action you want, such as “Copy table data to the clipboard.”
- Paste to your spreadsheet.
Interactive Maps Made Easy
Sign Up Now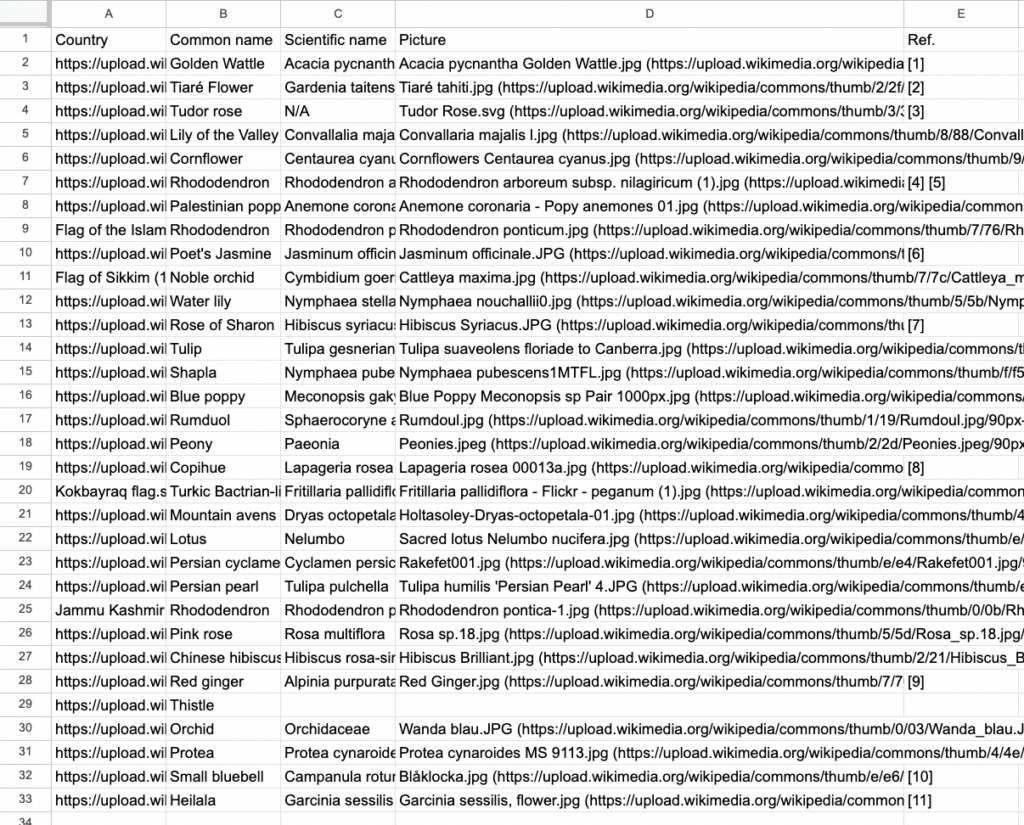
Now that you’ve gathered your data, you may still need to do a few clean-up tasks, such as splitting the associated text into different columns from the actual image links. You can prepare your data in Excel, but follow these steps if you’re a Google Sheets user:
- Select the column containing the information you want to split.
- In the “Data” tab, opt to “Split text to columns.”
- In the pop-up box, choose “Custom” and type in the “Separator” (in our case, an open parenthesis).

Most of your data should now be separated into two columns, though you can manually fix any that weren’t formatted properly. Update each heading to better distinguish the two, and now you’re ready to create a custom map of your data and images.
Map Your Data and Images
Follow the usual steps of creating a BatchGeo map:
- In your spreadsheet, select (Ctrl+A or Cmd+A) and copy (Ctrl+C or Cmd+C) your data, including image links.
- Open your web browser and navigate to batchgeo.com.
- Click on the location data box with the example data, then paste your data (Ctrl+V or Cmd+V).
- Check that you have the proper location data columns by clicking “Set Options.”
Here’s the important part: Before you click “Map Your Data,” select “Show Advanced Options” and select the correct column for your image data in the “Image URL” dropdown. Now you can watch the geocoder perform its process while also incorporating your images into the map, which should look something like this:
View National flowers and trees in a full screen map
There you have it! Your map of Wikipedia data is complete with images thanks to BatchGeo!
