5 Steps to Become a BatchGeo Power User

You know BatchGeo as the fastest, easiest way to get your data visualized on a map. Many of your favorite features, such as map data groups, are automatic. There are a few tricks to get the most out of your data, specifically the stuff that shows up within the Marker Box that appears when someone clicks a place marker. This is where anyone using your map can get additional information about each location. You can set a title, re-order data, add images, and more. Master these advanced options and you’ll be well on your way to being a BatchGeo power user.

1. Set a Title for Your Marker Box

By default, the first item in your Info Box will be the full location that was used to geocode the place. Many times that will be what you want, but other times there is a more descriptive name in another field of your spreadsheet. You can designate this field as the title, which will list it in bold at the top of your Marker Box.

Add title to Marker Box

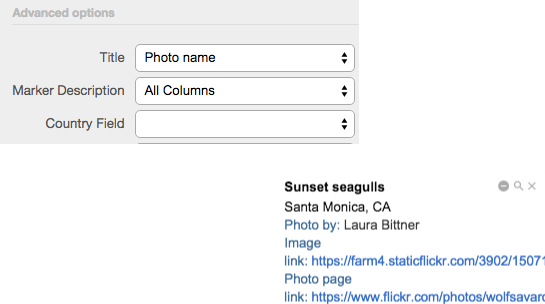
Choose Validate and Set Options to reveal your example Marker Box and the set of basic options. Then choose Show Advanced Options. The first in the list at the left is the Title option, which allows you to select any field, including location fields.

2. Re-order Your Data

BatchGeo intuits the order of your data from your spreadsheet. You have complete control over the order your data appears in the Marker Box by changing the order within your spreadsheet. The left-most columns will display first within the Marker Box and the right-most columns will show last. Of course, you can catapult one field to the front by setting it as your title, but the other field ordering will follow the spreadsheet.

To re-order your data, return to your spreadsheet. If you no longer have the spreadsheet, you can copy from BatchGeo. While editing your map, click into the map data and copy with Ctrl+C (Cmd+C on Mac). Then open an empty spreadsheet and paste with Ctrl+V (Cmd+V on Mac).

Choose the spot where you want to move your data and insert a new column. Then you can highlight and drag an entire column, or use Cut (Ctrl+X or Cmd+X on Mac) and paste. When your data is in the desired order, add it back into your existing BatchGeo map through the map data box.

3. Add an Image for Every Location

Your Marker Box can hold more than text, it can also display an image. To add an image to a location, you’ll need to make sure there is a field that contains a full URL to an image on the web. A full URL starts with the http:// or https:// and continues to include the domain name and path to an image file. For example, http://i.imgur.com/pY3JZsH.jpg is a full URL. You’ll need to use your own image host, or point to someone else’s image with permission.

Add an image to Marker Box

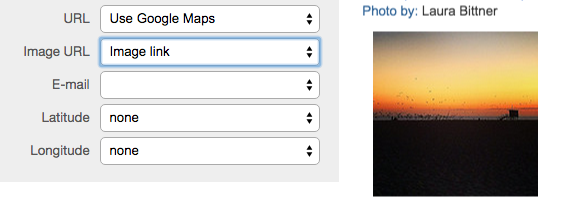
Once you have a column in your spreadsheet containing URLs to images, you can Show Advanced Options to reveal the Image URL drop-down. Select your field and the Marker Box preview will show you how the first item looks with your image.

4. Add Supplemental Data with Links

Similar to the image field, you can also create a hyperlink to supplemental data, such as a website with more information about a location. Again, this will need to be a full URL added to an additional column in your spreadsheet. This can be a web page that you control or another, such as an official website or visitor review page. Just make sure it’s the full URL, including http:// or https://, as described in the image step.

Link to a page

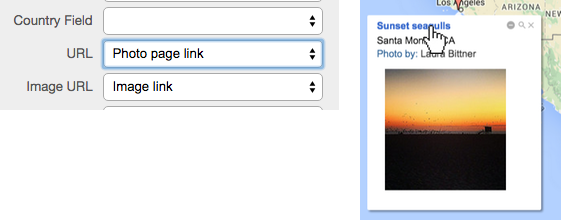
The URL field under Advanced Options defaults to a Google Maps link, but you can make it any page on the Internet. Select the name of the column where you have the web URL in your spreadsheet and it will appear one of two places: if you have a title selected, it will now be clickable; otherwise, the link will display at the bottom of the Marker Box.

5. Scroll to Reveal Your List

This last step toward becoming a BatchGeo power user isn’t exactly related to the Marker Box, but it’s another way to see the same data. Every map with 500 or fewer locations comes complete with a list of every location for easy scrolling and searching. It works in full map view, as well as with your embedded maps. With your mouse cursor over any portion of the map, scroll the page with the keyboard, scroll wheel, or other mechanism. You have now revealed the entire list of locations.

Scroll to reveal your list

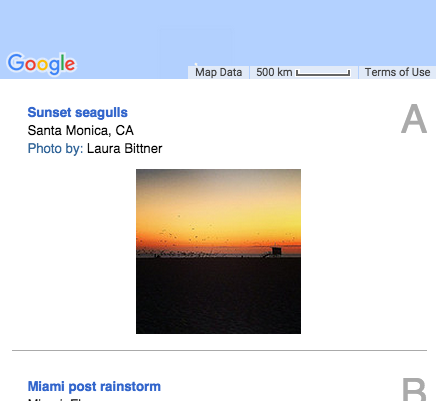
Everything available within the Marker Box is also displayed in this list. You can use your browser’s built-in Find option (usually Ctrl+F or Cmd+F on Mac) to search for keywords within the data, or just browse the list, which is displayed in your spreadsheet order. If you’re using the grouping feature, the list will be constrained to whatever is visible on the map. Even better, any map labels are also included in the list and each item is clickable, opening up the Marker Box to show the location on the map.

The list reveal can be enabled or disabled in the Render Method section when editing your map. Loading the Map Only is a little faster, but the Map + Data method gives you the searchable, scrollable list.

Of course, there’s plenty more than these five tips available to BatchGeo users. Browse the knowledge base or see how BatchGeo can help your business by uncovering the meaning behind your data.

Where Do Rich People Live?

Whenever the stock market fluctuates wildly in any direction you’ll read about people’s fortunes changing in a single day by what most of us will not make in a lifetime. Despite the wealth we can hardly understand, these billionaires do not each live on their own private island. In fact, most are in major cities around the world, often close to their business interests. The map below shows the hometowns of the world’s richest, according to the annual Forbes list.

View Cities with the Most Billionaires in a full screen map

This map may look a little different than the usual list you expect from Forbes. Where are Bill Gates, Carlos Slim, Warren Buffett, and others? They live in cities that are otherwise unpopular with their fellow billionaires. In fact, Forbes notes that these 20 cities are home to more than one-third of the world’s billionaires. But that leaves 1,181 of the richest that live elsewhere.

Gates lives in the Seattle, Washington, area, which does not have the 14 other billionaires, so his hometown misses this map, as does Slim’s Mexico City, and Buffett’s Lincoln, Nebraska. The cities that do make this map are internationally recognizable, from New York City (#1, 78 billionaires) to Jakarta (#20, 15 billionaires).

New York is to be expected, long the center of the world’s financial markets. Its counterpart across the Atlantic, London, is #4, with 46 billionaires. Between the two are the emerging powerhouses of Moscow (68) and Hong Kong (64). Rounding out the top five is Beijing (45), nipping at London’s heals.

The representatives from those cities may be faces you’re less familiar with. Certainly the Koch brothers of New York are perennial top 10s. But have you heard of Murat Ülker? The owner of a Turkish food conglomerate, Ülker has a net worth of $4.4 billion and a Wikipedia page with a biography of fewer than 100 words.

Similarly, Facebook co-founder Dustin Moskovitz does not have the household name of Mark Zuckerberg, but Moskovitz is the richest person in San Francisco. Here is the full list of the top 20 cities that the rich call home, along with the most affluent resident.

Rank City Billionaires Richest Net worth Source
1 New York, New York 78 David Koch $42.9 B diversified
2 Moscow, Russia 68 Vladimir Potanin $15.4 B metals
3 Hong Kong 64 Li Ka-shing $33.3 B diversified
4 London, United Kingdom 46 Len Blavatnik $20.2 B diversified
5 Beijing, China 45 Wang Jianlin $24.2 B real estate
6 Mumbai, India 33 Mukesh Ambani $21 B petrochemicals, oil & gas
7 Seoul, South Korea 29 Lee Kun-Hee $11.3 B electronics/insurance
8 Istanbul, Turkey 28 Murat Ulker $4.4 B food manufacturing
9 Paris, France 27 Liliane Bettencourt & family $40.1 B L’Oreal
10 San Francisco, California 26 Dustin Moskovitz $7.9 B Facebook
11 Sao Paul, Brazil 25 Jorge Paulo Lemann $25 B beer
11 Shenzhen, China 25 Ma Huateng $16.1 B internet media
13 Taipei, Taiwan 24 Terry Gou $6.1 B electronics
14 Los Angeles, California 22 Patrick Soon-Shiong $12.2 B pharmaceuticals
14 Singapore 22 Robert & Philip Ng $9.6 B real estate
16 Shanghai, China 19 Tsai Eng-Meng $8.9 B food, beverages
17 Delhi, India 17 Shiv Nadar $14.8 B information technology
18 Dallas, Texas 16 Andrew Beal $11.7 B banks, real estate
18 Tokyo, Japan 16 Tadashi Yanai & family $20.2 B retail
20 Jakarta, Indonesia 15 Chairul Tanjung $4.3 B diversified

If you’d like to see the ways to visualize the data above on BatchGeo, you can create a map like the one above by simply copying the figures above into our map making tool. Or keep exploring money makers with this map of US incomes, though you’ll find those numbers a bit smaller than the billionaires discussed above.

Where Are the World’s Tallest Buildings?

Right now in Guangzhou, China, workers are constructing the CTF Finance Centre, which is already considered in the top five tallest buildings in the world. It is due to open in 2016 as a shopping mall, offices, residences, hotel, and, observation deck. China is home to one-third of the 100 tallest buildings in the world, all of which are plotted in the map below. You can see the “hot” regions due to BatchGeo’s clustering feature. In addition to rank, you can explore the buildings by height in feet, meters, and number of floors. Further, you can check out the years they were built, though as you’ll see later, that’s a young building’s game.

View Tallest Buildings in the World in a full screen map

Second to China for the share of the world’s tallest buildings is the United Arab Emirates. Most of those buildings, the first of which was built in just 1999, are in the luxurious, ultramodern Dubai. That city is also home to the very tallest building in the world, the Khalifa Tower, which opened in 2010. Five others of the top 100 are in UAE’s capital of Abu Dhabi.

Tallest Buildings

Third on the list is the United States, which was previously a tall building superpower. From 1930 until 1998, a building in the US held the distinction as tallest in the world. First the Chrysler Building in New York City, though it was surpassed the next year by the Empire State Building. The Sears Tower, now Willis Tower, in Chicago took the crown in 1974.

For a brief time in 1973, the original World Trade Center buildings in New York were the tallest. If they still stood, they would both make the top 20, despite the many buildings that have been built in recent years. One World Trade Center, built at the site of the former buildings, is now the tallest in the United States, fourth in the world. It was completed in 2014.

Building ever-taller structures relies on advancements in industrial technologies. That any buildings from the 1930s still make the top 100 list is a feat itself, let alone that the Empire State Building is still #14. As you can see from the interactive chart above, this list favors buildings constructed in recent years.

And that’s a pretty conservative definition of recent. There are over four years left in the current decade and already two-thirds of the world’s tallest buildings were built during that timeframe. Another 20 were built in the 2000s. In fact, only nine of the tallest buildings were built before 1990.