Map of Top Colleges in the US

As teenagers return to school in the US, those in their final year of high school will be thinking about where to apply for college. A lot of factors go into what university is a good match for students, and you’ll see plenty of lists that rank them. The map below is based on data from US News about what it calls National Universities. With the top 100 mapped, you can use BatchGeo’s grouping functionality to drill down on what you want to find.

View Top Universities in the US in a full screen map

The map is initially grouped by ranking, and we’ve automatically provided ranges for you to select if you want to restrict to only the top or bottom universities. Of course, to make the list, they all have to be pretty good. Choose the menu in the lower left of the map to select other data from the list, including in-state tuition (same as out-of-state for private schools), out-of-state tuition, enrollment (number of students), acceptance rate, retention rate (freshmen who return), and graduation rate (undergraduates who graduate within six years).

You can select a couple groups of one type, then switch types to further restrict the map. For example, click top two ranking groups to see those in the top 11. Then switch to Acceptance Rate. All but two groups will be faded, which tells us that the top 11 does not accept more than 20.4% of applicants (in fact, click through the markers and you’ll see that Duke University, #8, has the highest acceptance rate of the top 11 with 12.4%).

Inexpensive colleges with high graduation rates
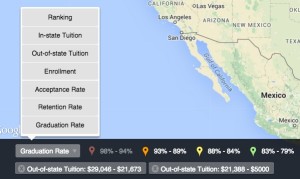
Perhaps exclusivity is not your thing. Click the group selector to clear your selections, then choose the Out-of-state tuition option. This provides the best apples-to-apples comparison for the cost of college, because in-state tuition typically has strict resident requirements. Choose the lowest three tuition ranges to see all the universities with less than about $30,000 annual cost.

Now, let’s make sure you have the best chance of a speedy graduation. Select Graduation Rate and the markers will switch colors based upon the range to which they belong. The best graduation rate is faded out, but select the second best and you’ll be left with two affordable universities with 90%+ graduation rates: University of California at Berkeley, and University of North Carolina at Chapel Hill.

This map view of top colleges is also useful for the student who wants to get very, very far from their parents. Just identify your home region on the map, then find a marker that isn’t close. For the parents, who want to keep their kids close, we actually have a special tool. Type your home town into the search bar above the map, press enter, and be whisked away to your nearest top school. This built-in feature allows BatchGeo customers to create a store locator tool, but here it does double duty as a school locator. It even works in tandem with the grouping feature, so you could find your closest university with under 13,000 students, for example.

There’s plenty more you can accomplish by exploring the different group types on the map. If you want to create your own map (for colleges or otherwise), we can help you, too. This top college data started as an Excel spreadsheet. What other data do you have in spreadsheets that could be transformed through a web map? Try BatchGeo now.

3 Ways to Style Your Interactive Map

It used to be that you had no control over how your map looked. Sure, you could add some markers, but the underlying look of the map was one-size-fits-all. Now you can have a choice of how your map looks, both in the shape and color of a marker, and the colors within the base map. In this post, we’ll share three different ways to style your map. The complexity varies, from the point-and-click simplicity of our custom map creator to alternatives that require code.

Google Maps

Let’s start with the obvious one. Google Maps is the de facto standard way to create a map for the web. The Google Maps API, used by programmers to tap into the functionality of the search giant’s geographic data, is over ten years old. Those with familiarity coding find the features robust, but it’s making a Google Map is complicated to the novice.

Google Maps style wizard

That said, the process of creating a stylesheet for a Google Map is easy. There’s even a wizard that you can use to preview changes. You can browse the selectors available for styling, use a color picker to find just the right hue, and adjust visibility. Google makes plenty of decisions for you, so you aren’t able to do everything you might want. You can’t change visibility of features by zoom level—you get the defaults that Google sets up. You also cannot add any layers that are not always on the map.

Still, Google remains popular. Indeed, it’s what the BatchGeo platform runs upon.

MapBox

If you’re an advanced user who likes lots of options, you’ll love MapBox. This geo startup is flexible enough to allow any data you want to be incorporated into to your map. If you’re a GIS expert (and that might help), you can import your Shapefiles and style them to your heart’s content.

MapBox Studio style editor

Due to its complexity, the full MapBox editor is only available as a downloadable application. By default MapBox uses OpenStreetMap data, so you have a starting place. You can style those base layers, add and style your own, and adjust much more than with Google Maps—including fonts and textures.

The end result is your own map tiles that MapBox serves to its own JavaScript library, Leaflet, or other map delivery product. You still need to write the code to interact with the map (as you do with Google Maps), but the customization is unrivaled.

BatchGeo

BatchGeo pre-selected stylesWe love maps and enjoy seeing all the different types that people can make. But we also believe maps should be simple to make—like copy and paste from your Excel spreadsheet simple. To balance customization and simplicity, BatchGeo pre-populates six map styles. Add to that three different marker styles in seven colors (10 colors for Pro accounts) and there are many ways to to have your map stand out from all the rest without a lot of effort on your part.

We used the Google Maps styler to create the six styles, one of which is shown in the above map. Our grouping feature automatically creates marker colors based on your data, and the clustering feature summarizes data below high density markers. In many cases, BatchGeo is all you need, and will save you hours of coding (or even having to learn).

Not every project fits into the presets we’ve selected. You may have an idea that requires advanced coding, your own GIS data, and fine-grained control over how elements of the map are displayed. But if you’re looking to display a list of locations on a map without learning to code, we invite you to try BatchGeo now.

American Football Hall of Famers Not All Born in Texas

We recently looked at our baseball hall of fame map of birthplaces, so it’s only fair that we give equal treatment to football, which holds its annual enshrinement this weekend. This year’s eight inductees bring the pigskin sport’s count of hall of famers to nearly 300. There are 37 states and eight countries represented amongst those 295 golden jacket wearers. Check out the map below to see them all plotted by their place of birth, proving geographically that they’re not all born in Texas.

View Football Hall of Famers by Birthplace in a full screen map

Texas may be the state known for its Friday Night Lights, but it’s been edged out by Pennsylvania as the top birthplace of Hall of Famers. Including this year’s representatives from each state, Pennsylvania has 31, with 30 from the Lone Star State. Rounding out the top five are Ohio (24), California (19), and Illinois (17).

In addition to being home of 24 of the football hall of famers, Ohio is also home to the Football Hall of Fame. According to the Pro Football Hall of Fame history, Canton was chosen in part because it was where the National Football League was founded. Coincidentally, two Hall of Famers were born in Canton, though Dan Dierdorf and Alan Page didn’t start playing professionally until after the Hall was opened.

While football is a popular high school sport in the United States, the top birthplaces don’t entirely match up with the top recruitment states. MaxPreps lists Texas as second to Florida for top players being courted by colleges. Pennsylvania is 15th on that list. Still, nine of the top 10 recruitment states have produced eight or more hall of famers. Alabama has produced six hall of fame football players, whereas only a few states have more top recruits.

Most of the 13 states do not have a native son representing in Canton are unsurprising. Alaska and Hawaii are distant. Delaware and Maine have small populations. That Iowa has not produced a hall of famed is baffling. The midwest is known for its love of football, after all. There’s a good chance that will be rectified soon—Kurt Warner was born in Burlington, right across the river from Illinois. Warner barely missed in 2015, his first year of eligibility.

Very likely the size of the football Hall of Fame, which opened in 1963, will soon surpass the membership of the baseball hall of fame, which first inducted players in 1936. Canton’s 295 is edging Cooperstown’s 310. Football adds more then five players per year, while baseball’s average is less than four.

One thing baseball and football’s hall of fames do have in common is Chicago. What is it about Chicago? Sure, it’s America’s third most populous city, but it’s by far the most common birthplace for baseball (9) and football (12) hall of famers, more-so than Los Angeles (five each) and New York (eight each).

How about foreign born players? There are twice as many in the baseball hall (17), but they represent almost the same number of countries (nine for baseball, seven for football). The countries represented between the two sports have very little overlap. Only three countries can boast a member of each hall born within their borders: Germany, Canada, and, of course, the United States.