How to Cluster Map Markers: Demo and Tutorial
Maps are a great way to show location data. The stories within the numbers appear when you can see them geographically. It might seem natural that the more points you add to a map the better story it tells, but that’s not always the case. Ideally you could summarize the underlying data, which requires map clustering technology. There are several ways to convert hundreds of markers into a reasonable number that still share the underlying story underneath. The approaches vary in effort and programming ability required, but all can bring even more understanding to your geographic data.
End Marker Overload
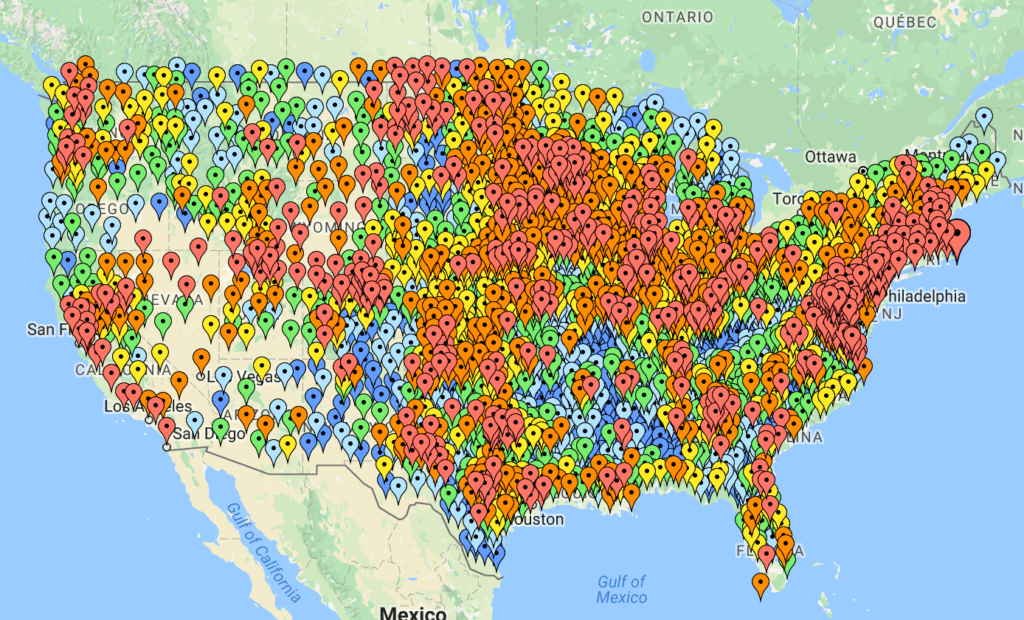
We’ve all probably seen web maps like this. There are so many markers on that map, you can’t even see the map. The colors of the markers tell some kind of story, but there’s so much overlap with other icons that you might well just be missing other data.
A map with fewer markers allows the viewer to take in the information, rather than being overwhelmed. The way marker clustering works is that it provides a summary marker that gives you an idea of what’s “below” at closer zoom levels. Typically, you click a clustered marker to automatically zoom into an area with either additional clustered markers or individual markers. The viewer is able to see just enough at each stage to make sense of where to click to investigate further.
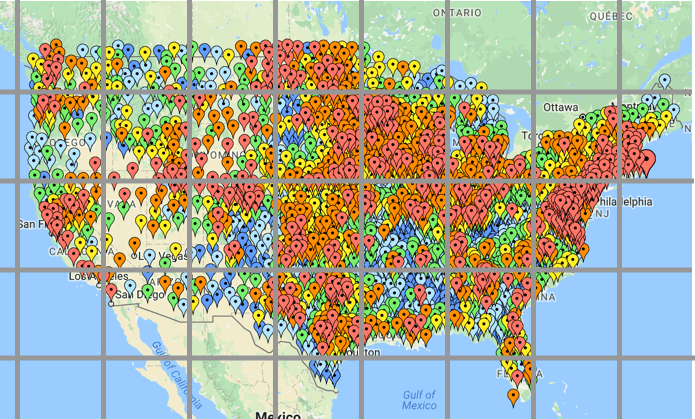
One way of creating clustered markers is to overlay a grid, as in the example above. Though, usually a visible grid is not used. Instead, the grid is defined by latitude and longitude coordinates to evenly segment the area of the map currently in view. Then, any markers within a particular grid are removed and replaced by a single marker, often labeled with the number of markers beneath.
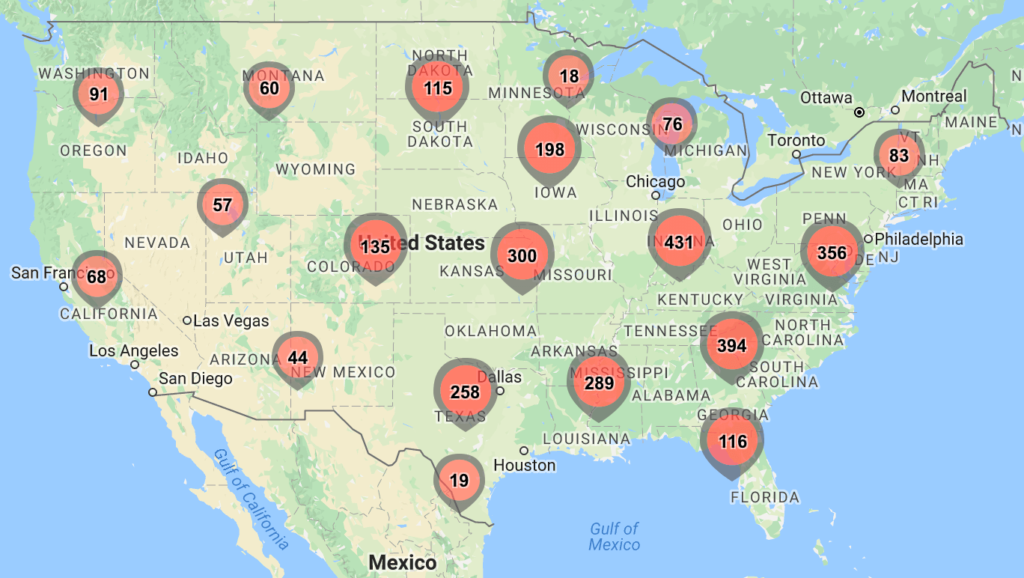
Above is one example of how a clustered map might look. In that example, the meaning of the color is removed in favor of the number of markers. However, you’ll see in the next section an alternative method that keeps that data visible within the clusters.
Interactive Maps Made Easy
Sign Up NowCopy-Paste Map Clusters
The easiest way to make web maps is to paste spreadsheet data into BatchGeo. You can include addresses, city names, or other location data, which get converted automatically into latitude and longitude coordinates. There are also several clustering options built into the service, which means you can get data-rich, readable maps in minutes.
Let’s say you have a spreadsheet with the average household income of every county in the United States. That’s actually the exact example of marker overload from the previous section. At over 3,000 counties to display, the map looks very crowded without clusters. Here’s how to make a much simpler map that better communicates the meaning of the data.
- Copy and paste your spreadsheet into the map making tool
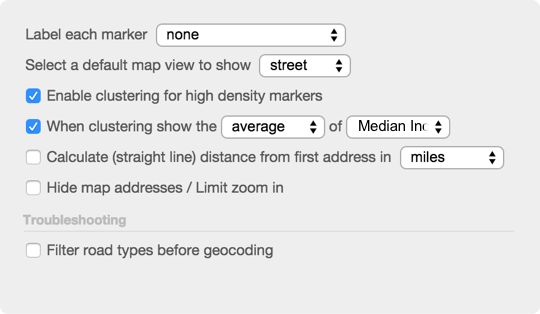
- Click Validate and Set Options, then Advanced Options
- Click Enabled clustering for high density markers
- Select the new option to choose average and Median Income (or whatever your data example)
- Finally, click Make Map
The result will be a map like this, with the average of the Median Income values for each county in a cluster displayed as the label.
View Household income, average clustering in a full screen map
You can also get a much simpler cluster that merely counts the number of markers below each cluster. To achieve this basic clustering, just skip step 4 in the instructions below. You can see this example on the BatchGeo marker clustering page, along with sum clustering, which adds up all values in a cluster, rather than averaging.
If these examples don’t suit what you need, you’ll likely need to dig in and write a little code yourself, though you may still be able to copy-paste some of it.
Use MarkerClusterer Library
Google Maps is essentially a standard on the web now. It’s everywhere, used by sites big and small. In fact, it’s the foundation of the BatchGeo example above. Though, when you make Google Maps yourself, you’ll need to write the code to perform some of the fancier bits.
Google provides an open source library to help turn existing Google Maps with markers into a clustered map. While you’ll need some programming background, you can find map tutorials on Google’s site. We can’t go into detail in this post about programming Google Maps, but we’ll show enough to see how the MarkerClusterer works.
The short version is that instead of making a marker like this:
var marker = new google.maps.Marker({
  position: {lat: 37.8077333, lng: -122.4750286},
  map: map
});
You add all markers to a clusterer, like this:
var marker1 = new google.maps.Marker({
  position: {lat: 37.8077333, lng: -122.4750286}
});
var marker2 = new google.maps.Marker({
  position: {lat: 37.9077333, lng: -122.5750286}
});
// Continue creating markers like above...
var markers = [marker1, marker2]; // add additional markers to the array if you have them
var markerCluster = new MarkerClusterer(map, markers);
So, instead of including the map variable in each marker, you pass map and an array of markers to the MarkerClusterer, which creates the clusters if necessary.
You’ll also notice that to create Google Maps, you must know the latitude and longitude coordinates. If you don’t already have those for your locations, you’ll need to use a geocoder to convert your addresses (and other location values) into coordinates.
Despite requiring code, using the MarkerClusterer is about as simple as you can get when building Google Maps yourself. If this is too much work, we recommend the copy-paste option above, which provides a lot of advanced mapping in a very simple approach.
However, if you want to dig even deeper, you’ll probably be writing your own clustering algorithm, or building off of other open source technology.
Write Your Own Clustering
This option is the most customizable, but obviously requires some significant coding skills. Since there are hundreds of different directions this could take, we won’t go into details here, but instead give a few resources to consider:
- Leaflet is an open source library used by the most hardcore of web mappers
- Leaflet.markercluster is a clustering plugin for Leaflet
- Anycluster is server-side clustering for use with Geodjango
These and more can be found in this GitHub search for those comfortable with code.
Interactive Maps Made Easy
Sign Up NowFor all others, we recommend checking out our spreadsheet to map tool right now. It’s free and has clustering built in.
