Author: Adam DuVander

How do I import addresses into Google Maps?

There’s a good reason why most of us use smart phones to get to a new place. Unless you know a city or area really well, an address doesn’t immediately enter your mind spatially. When we can see a place—and the route to get there—on a map, it becomes clearer.

The problem grows when you have many addresses—potentially hundreds. When you want to visualize all of your holiday cards on a map or create a customer sales map you need a way to import all those addresses into Google Maps or some mapping tool.

Below you’ll find three simple steps to use when importing addresses into a map.

1. Make Sure Your Address List is in Excel or Other Spreadsheet

The spreadsheet and its similar file formats (CSV, tab-delimited, as two examples) is a universal way to move data between systems. You can share spreadsheets with almost anyone, often for free. There are also online services, like Google Sheets (part of the Google Docs Suite), that can help you quickly store and share your data.

For many people, your list of addresses may already live in Excel or another spreadsheet. That’s great! However, if you don’t yet have the data in spreadsheet form, there’s likely a way to export your contact addresses from wherever they are stored.

Export Outlook Contacts to Excel or CSV

While Outlook is best known for storing email addresses, you can also put additional contact information, such as addresses. If that’s the case, you’ll want to export them from Outlook so you can get them into a spreadsheet format.

The exact instructions will vary based on the version/edition of Outlook you own, so you’ll want to follow the Microsoft instructions. Regardless of which Outlook you have, you’ll want to look for an “Export” option in the file menu or search the program’s help option.

The best file type for your export is likely a CSV, the abbreviation of “Comma Separated Values.” This type of file is a plain text file with individual fields separated by commas. Plain text means it can be read in by any spreadsheet application, such as Excel, Numbers, or Google Sheets.

Export Apple Contacts to Excel or CSV

Apple’s application for storing addresses and other information is called Contacts. It is a Mac app that comes on your computer. If you have an iPhone, those contacts are likely synced to this application.

There is not a direct way to export from Contacts to a spreadsheet file. Instead, you need to export as Apple’s vCard format. Go to the File menu, then select Export, and then the vCard option. Once that is saved to your computer, you can use a service like this Online vCard Converter to get a CSV of your contacts.

This CSV file will include comma separated values (that’s where the acronym comes from) in a normal text file. You can then read that file with any spreadsheet application.

Export Google Contacts to Excel or CSV

Outlook and Apple Contacts are both primarily computer software, whereas Google Contacts only exists as a website. Regardless, you’ll still find an export option within the tool under the “More” menu option.

As with the others, the goal is to get a spreadsheet file. You’ll get two options for CSV, a comma separated values format that is plain text. Choose either of these and download the google.csv to your computer. You can now use that file to open your contacts in any spreadsheet application.

Export Addresses from Any Application

Your contacts may be stored in another application, such as a CRM (customer relationship management) tool, sales tracker, or similar. If you can retrieve contacts in CSV format, you’ll be set. Most of these tools support CSV (comma separated values), which is a plain text file that any spreadsheet application should be able to open.

If you aren’t sure how to export your contacts, try searching the application’s help document, search using Google, or reach out to the company’s support team.

2. Remove Contacts Without Addresses

Now that you have all your contacts in a spreadsheet format like CSV, open up the file in your spreadsheet application. If you don’t use Excel or Numbers, you can add it to Google Sheets by uploading it to Google Drive. Once uploaded, there will be an option to open in Google Sheets.

Depending where your list came from, there may be contacts without addresses. For example, you may have many records with only email address stored if you export from Outlook. Similarly, your Apple Contacts may be filled with only telephone numbers if it came from your iPhone. The key in this step is to remove contacts without street addresses, because those won’t show up on a map.

In Google Sheets, click the address column and sort it:

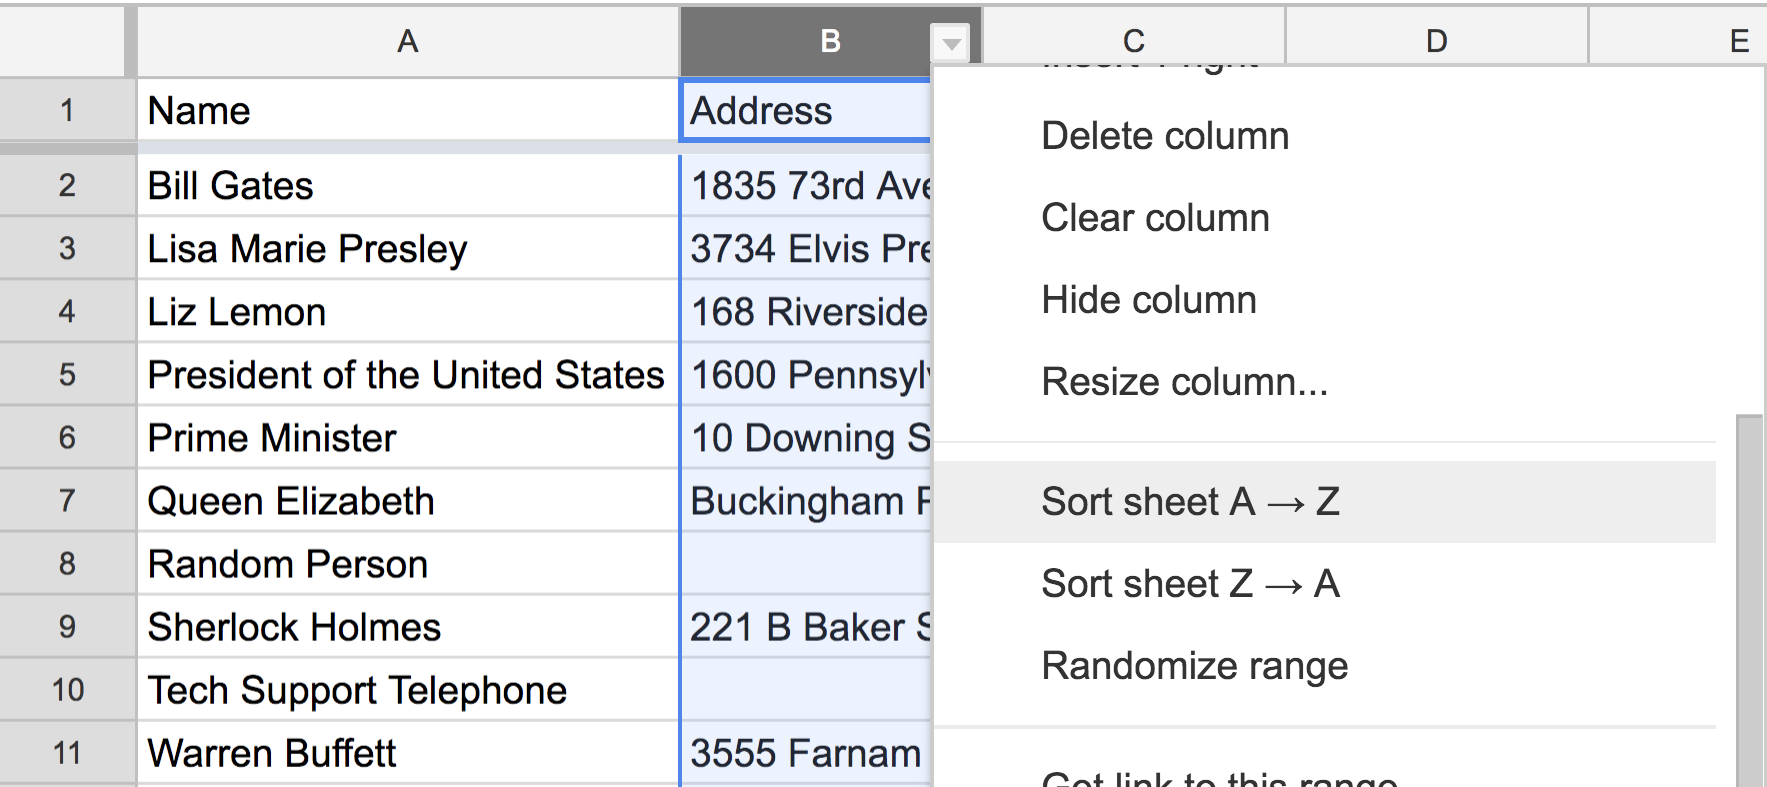
Then you’ll be able to see all your contacts with addresses in one place:

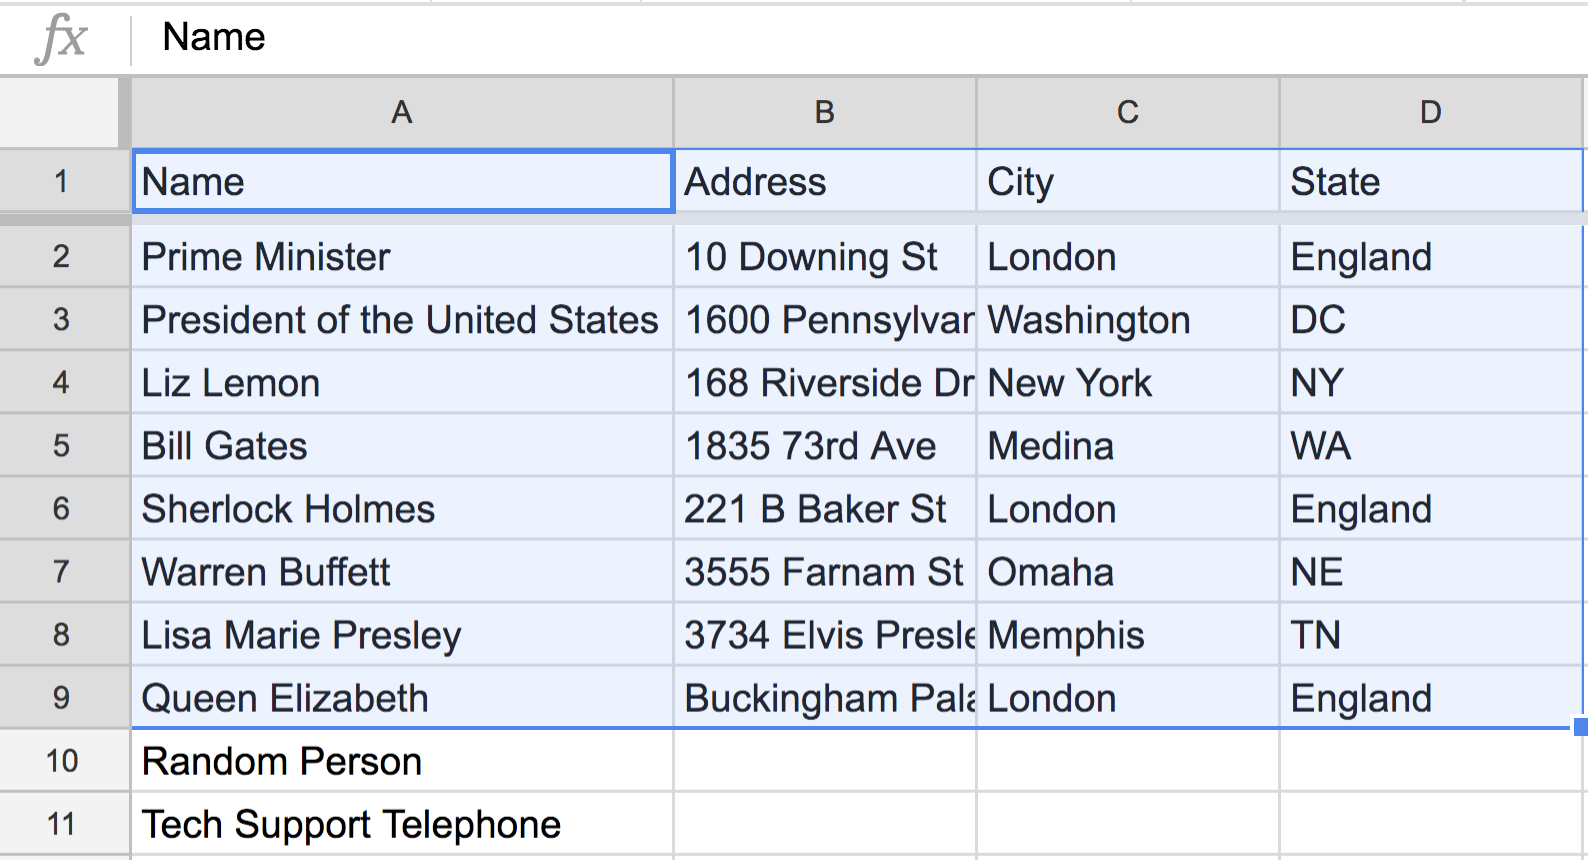
You can copy these to their own sheet, delete the contacts without addresses, or simply leave out the non-address contacts in the next step.

3. Copy and Paste All Contacts

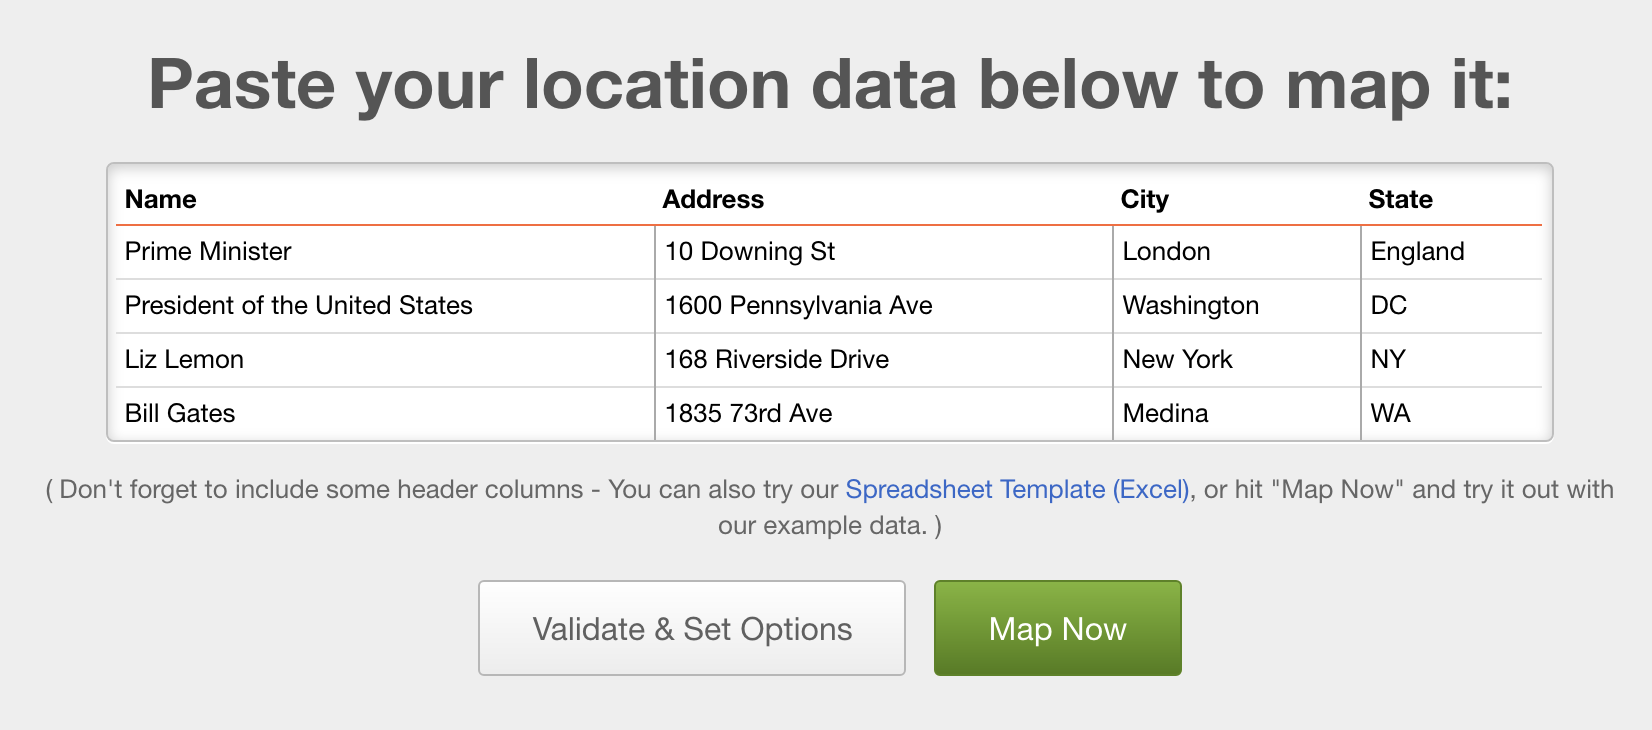
Your spreadsheet is now sorted with your contact addresses grouped together. Now comes the part where we put them on a map! Using address import mapping tool it’s as easy as copy and paste:

  1. Select all of your contact columns from your spreadsheet, including the headers
  2. Copy the selection using the keyboard shortcut Ctrl+C (Command+C on Mac)
  3. Click into the location data box in BatchGeo and paste with Ctrl+V (Command+V on Mac).

Click the “Map Now” button and you’re done.

And in seconds, here’s the map created from my contacts:

View Import CSV Example Map in a full screen map

You’ll probably have more than just a handful, maybe even hundreds of sales leads, customers, friends, or other contacts. BatchGeo is the fastest, easiest tool to create a map from a spreadsheet of addresses. Use your own data to try it today for free!

How do I use my address map?

Once you’ve created your map, you’ll want to put it to use. Maps tell a story, and there are unlimited interpretations within them. That said, here are some things to consider for your map of contacts in your address book:

  • Visualize your customers or friends: do you know what regions or neighborhoods where many of them live? Maps make these clusters stand out.
  • Visit your customers or friends: search your map for nearby contacts and always be able to find those that are closest.
  • Export Google Earth KML to move your geolocated contacts to other geographic systems.

These and many other possibilities are on the other side of your contact map!

Cities Around the World by Latitude and Longitude

Every city in the world has one thing in common: they each have a pair of coordinates, numbers that describe their location. While no cities can share both sets of coordinates (since it’s the exact location of the city), many share one of the numbers that make up their coordinate pair.

These coordinates, called latitude and longitude, are used to create maps like the one below. In addition to the cities’ exact locations, we found their nearest latitude and longitude (within 5 degrees), and you can filter the map by these ranges.

View Cities by Latitude & Longitude in a full screen map

Read on to find out more about latitude/longitude coordinates, and see some surprising commonalities when we look at cities with the same latitudes or longitudes.

What are Latitude and Longitude?

Before you can interpret the map above, you need to know about the pair of numbers used to plot map coordinates: latitude and longitude.

Latitude is the number of degrees north or south of the equator, the imaginary line that runs horizontally through the Earth.

Longitude is the number of degrees east or west of the prime meridian, an even more imaginary line because it was made up.

Stand up and imagine your feet represent an exact point on Earth. Do you know which way North is? Use one arm to point precisely North and position your other arm in the exact opposite direction. The line your pointing makes would be the longitudinal line for your location. Now move your arms to point East and West. The line formed by your arms is the latitudinal line for your location.

While latitude is determined by the equator, humans had to make up a midpoint for longitude. In 1851, Sir George Airy chose the observatory in Greenwich, England, an area of London, to be zero longitude. Thirty years later, 25 nations met to officially declare it the prime meridian.

Every point on Earth can be described by a number of degrees latitude and a number of degrees longitude. Like an algebraic plot, each number can be positive or negative. In other words, we’ve taken a circular Earth and separated it into quadrants. The mid-point of these quadrants is 0 degrees latitude (the equator) and 0 degrees longitude (the North-South line that runs through Greenwich Observatory).

Latitude increases as you go North, making the Northern Hemisphere positive latitude and the Southern Hemisphere negative latitude. Paris, for example, is at about 48, 2. Latitude usually comes first in the pairing. Latitude runs between 90 degrees South (-90) and 90 degrees North, both extremes coming at the Earth’s poles.

Longitude increases as you go East, making Eastern Hemisphere (i.e., most of Europe) positive longitude and the Western Hemisphere negative longitude. New York, for example, is at about 40, -73. It’s North of the equator and West of the prime meridian. Longitude runs from 180 degrees West (-180) to 180 degrees East. Since longitude wraps around the Earth, -180 and 180 are the same line, on the opposite side from the prime meridian.

Using the map, can you find some cities in the southeastern hemisphere? Southwestern? Which “quadrant” do you live in?

Cities on the Equator and the Prime Meridian

While much of the worth is solidly within hemisphere quadrants, there are many cities that straddle one of the zero points. These cities, by definition, must be either along the equator or the prime meridian (i.e., have a similar longitude to London).

The map shows 22 cities that are within two and a half degrees of the equator. You can find them by using the grouping function in the lower left corner of the map. Choose “Near Latitude” and then choose the 5 to -10 range. Or, search the map for “0” and choose “0 (Near Latitude).”

Macapá, Brazil; Quito, Ecuador; Padang, Indonesia; Libreville, Gabon; Kampala, Uganda

To get even more specific, we narrowed down to 11 cities that are less than a degree away from Earth’s horizontal midpoint. The closest to the equator is Pontianak in Indonesia, whose city center is within one second (1/60th of a degree) of zero degrees latitude.

Here are all 11 of the places within a degree of the equator:

  • Macapá, Brazil
  • São Tomé, São Tomé and Príncipe
  • Libreville, Gabon
  • Entebbe, Uganda
  • Kampala, Uganda
  • Pekanbaru, Indonesia
  • Quito, Ecuador
  • Kismayo, Somalia
  • Padang, Indonesia
  • Pontianak, Indonesia
  • Yaren District, Nauru

Since zero longitude is within densely populated Europe, there are more places that are close to this human-created coordinate. The closest, of course, is London—or Greenwich, specifically. There are 44 cities on the map that are closest to 0 longitude. Yet, there are only a dozen that are less than one degree from zero.

Greenwich, England; Accra, Ghana; Valencia, Spain; Bordeaux, France; Le Havre, France

Here are all 12 places within a degree of the prime meridian:

  • Accra, Ghana
  • Tamale, Ghana
  • Zaragoza, Spain
  • Valencia, Spain
  • Lleida, Spain
  • Bordeaux, France
  • Brighton and Hove, England
  • London, England
  • Greenwich, England
  • Le Havre, France
  • Cambridge, England
  • Peterborough, England

A much less populated place? The opposite of the prime meridian. At either 180 or -180 (it’s the same place), you’ll find just two places. One is far north and another in the south: Rabi Island, Fiji; Anadyr, Russia. Move the map around and see if you can find them!

Famous Cities and Their Coordinate Partners

Photo by Javier Vieras

Ah, Paris. The City of Lights. A place for lovers. Yes, Paris seems like a magical place. Yet, it is on the same latitude as Seattle, a place best known for… rain. While Seattle is slightly rainier than Paris, it’s not by much. Similarly, London gets a bad rap and it’s only a few degrees north of Paris.

Photo by Vincent Desjardins

Surely New York City has a similar reality distortion field, causing it to appear better than other places of similar latitude? At 40 degrees North of the equator, the snowy-wintered New York is at a similar longitude to… Portugal, Spain, and the rest of the beautiful Mediterranean. To be fair, Sendai, Japan, is also around 40 degrees latitude, and it has nearly freezing temperatures in January.

Longitudinally, New York is around the same at 73 degrees West as most of the country of Chile. Interestingly, South America is almost entirely east of the United States. The time zones range from UTC -05:00 (same as Eastern time) to UTC -02:00.

Photo by Larissa Paschoal

Speaking of South America, São Paulo, the largest city in the Southern Hemisphere, is 22 degrees South of the equator. That puts it similar to Johannesburg (the capital of South Africa) and Brisbane (the third-largest city in Australia). On the longitude scale, much of Brazil has no countries North or South of it. Seriously, check the map! The only non-Brazilian place at 50 degrees West is the tiny and remote Qaqortoq, Greenland.

The Far North and South

Locations in the North and South are best known for their extremes. The poles are each covered in snow year round, so expect cold temperatures in these cities to the far North and South.

The Northernmost city in the world is Alert, Nunavut, Canada, at more than 82 degrees North. That puts Alert just 550 miles (885 km) from the North Pole. In Europe, Norway’s Ny-Ålesund is over 78 degrees above the equator. And Alaska is home to the northernmost U.S. city of Barrow, at 71 degrees latitude.

The Southernmost city in the world is Puerto Williams, Chile, and it’s nearly 10 degrees farther south than any other continent’s southern city. At 54 degrees below the equator, it may not seem as far south as you expect. However, Antarctica reaches out to about 60 degrees latitude, so there’s not much room for inhabited cities much closer.

Other far-Southern cities include Invercargill, New Zealand (46 degrees South) and Cape Town, South Africa (at -33 degrees latitude).

370 Cities Mapped: Commute Times and Transportation Rates

Everyone likes to moan and groan about traffic conditions around the water cooler at the office, but some cities have it worse off than others. That’s why we mapped the transportation details of 370 U.S. cities, as well as each city’s commute time. Before you make traffic the focus of your next work conversation, see which cities have working populations that spend over 45 minutes commuting to work each day, and note the most popular form of transportation in each city.

View Travel Modes and Times Map: Average Commute Data in a full screen map

Click through the map above to see how your city stacks up among 370 U.S. cities’ transportation rates and commute times, or keep on reading for highlights from the map.

Highest and Lowest Average Commute Times

The city with the highest average commute time out of 370 cities is New York City. New York City is also the most populated city in the United States, so it’s no wonder it takes an average of 45.9 minutes for workers to get to and from at their workplace each day. The highly populated city also happens to have the highest transportation rate, likely the result of being home to one of the largest subway systems in the world. While it may take longer for people to get to and from work, New York’s high public transportation rate is what makes New York City one of the most energy-efficient cities in the U.S.

The city with the lowest average commute time to and from work is Wichita Falls, Texas. With a working population of 56,755, it only takes workers 16.2 minutes on average to get to the office. Notably, Wichita Falls also has one of the lowest public transportation rates of all 370 cities at 1%. Most workers drive alone to work or carpool in this Texas city, with a drive alone rate of 78.8% and 5.8% carpool rate.

Public Transportation’s Top Ten

There is a big drop in the rates between our number one city with the highest rate of public transportation and our number ten city, as you can see in the chart below. This large range in the top ten for public transportation may be explained by a multitude of things, including varying population sizes. The population sizes of our top ten range from seven figures in New York City and Chicago, to low six figures in Jersey City. Fewer people can mean a city may provide fewer options for public transportation.

City Public transportation
1. New York, New York 58.8%
2. San Francisco, California 40.1%
3. Boston, Massachusetts 39.0%
4. Washington, District of Columbia 36.5%
5. Chicago, Illinois 33.1%
6. Jersey City, New Jersey 32.8%
7. Cambridge, Massachusetts 28.2%
8. Philadelphia, Pennsylvania 26.7%
9. Seattle, Washington 24.0%
10. Arlington, Virginia 22.3%

The South Drives Alone

The top ten cities with the highest percentage of people who drive alone to work include six cities located in the Southern states of Texas, Alabama, Lousiana, and South Carolina. This is not surprising seeing as the South is pretty sprawled out. The best way to get to work may just be to drive yourself. The cities of Beaumont, Texas, Huntsville, Mobile, and Birmingham Alabama, Shreveport, Louisiana, and Greenville, South Carolina all have over 87% of their working populations who drive alone on their commute to work.

The other four cities which make up the top ten cities with the highest drive alone percentage includes three Michigan cities: Southfield, Troy, and Livonia, Michigan. Michigan’s small monopoly of the top ten is not too surprising seeing as Detroit is known as the car capital of the world. A city in Iowa concludes the top ten cities with the highest percentage of workers who drive alone.

The commute times of these top drive alone cities range from the highest commute time of 30.9 minutes in Troy, Michigan to the lowest of 19.9 minutes in Davenport, Iowa.

Working Population: N.Y. vs. L.A.

While New York City and Los Angeles may be located at opposite ends of the country, they happen to have the two highest working populations in the entire United States. However, while they may have high working populations in common, these two cities tell very different stories when it comes to the makeup of their primary modes of transportation as well as their commute times.

New York City

Photo by Roberto Faccenda

New York, New York, the most populated city in the United States, has a working population of 4,734,420 people. As you’ve already read, the public transportation rate is the highest of all of the 370 cities on our list at a whopping 58.8%, and the average commute time is 45.9 minutes, the longest of them all. Of the 4,734,420 people who work in the city, 22.5% drive alone to work, while 4.2% carpool.

Los Angeles

Photo by Frederick Dennstedt

Just like New York City, Los Angeles, California has a high working population of 2,135,451, the second highest of the 370 cities. However, the similarities between New York City and L.A. stop there. Whereas only 22.5% of New Yorkers drive alone to work, 70.6% of L.A. residents drive alone. L.A. also has a higher carpool rate than New York City: 9.2% of L.A. workers carpool to their jobs as compared to New York City’s 4.2%. Compared to 58.8% of New Yorkers who opt for public transportation over the alternative, only 9.0% of L.A. residents take public transportation to work.

There are, of course, pros and cons to each city’s transportation profile. Even with California traffic, L.A. beats out New York City when it comes to average commute time with a 35-minute commute in L.A. versus the longer 45.9 minutes in New York City. However, New York City is much more energy efficient than L.A. due to its high public transit rate, which for some, may be worth the additional time spent in traffic.

California Cares About Carpooling

As we just saw, Los Angeles, California may not care much about carpooling with a rate of 9.2%, but that doesn’t mean the city speaks for the rest of California. In fact, six out of the ten cities with the highest carpooling rates are located in California. Santa Maria, Oxnard, Richmond, Alhambra, Chino, and San Bernardino, California all have carpooling rates of over 13.5%. While that may not seem like a lot, compared to the carpool rate of the lowest carpooling city, New York, New York at 4.2%, these six California states must be doing something right. Additionally, if we expanded the top ten cities with the highest carpooling rate to the top twelve, California cities would take up eight out of those twelve spots.

The rest of the cities in the top ten include three New Jersey cities. Passaic, Trenton, and Peterson, New Jersey all like to carpool, just like the last city to make up the top ten carpooling cities, Honolulu, Hawaii.


Of the 370 cities we mapped, how did your city stack up in commute time, public transportation and drive alone rates, working population, and carpooling? Make your very own map like this one with BatchGeo by simply copying and pasting. Try it now.