Best Air Quality vs the Most Polluted Cities in the US
There’s not much that’s more essential than the air we breathe. But our constant inhaling can have negative health effects if we don’t live in one of the cleanest cities in America. While air pollution exists almost everywhere in this post-Industrial Revolution world, it’s often most widespread in well-populated metropolitan areas.
Individual pollutants, such as ozone levels (smog) and particle pollution—or soot—reach the highest levels in the air of the most polluted cities in the US, as the map below shows. In addition to the two most common pollutants, the map contains other types of air pollution like carbon monoxide and lead, along with nitrogen and sulfur dioxide.
View Outdoor Air Quality in the U.S. in a full screen map
Use the map to review the cities with the highest and lowest pollutants, including the 4th highest daily max 8-hour average of ozone levels in the year or the mean PM2.5 weighted by calendar quarter for the year. Or, read on to see what we’ve discovered in the EPA’s data.
Smoggiest Cities in California & More
While there are many air pollutants (carbon monoxide, lead, nitrogen oxides, and sulfur oxides), two types are more common, especially in cities. One of the most widespread is ozone pollution, otherwise known as smog.
Breathing in smog irritates and inflames the lungs. Unfortunately, more smog or ozone can be found in the air of the following metropolitan areas than anywhere else in the U.S.
- Riverside-San Bernardino-Ontario, CA – 0.125 ppm
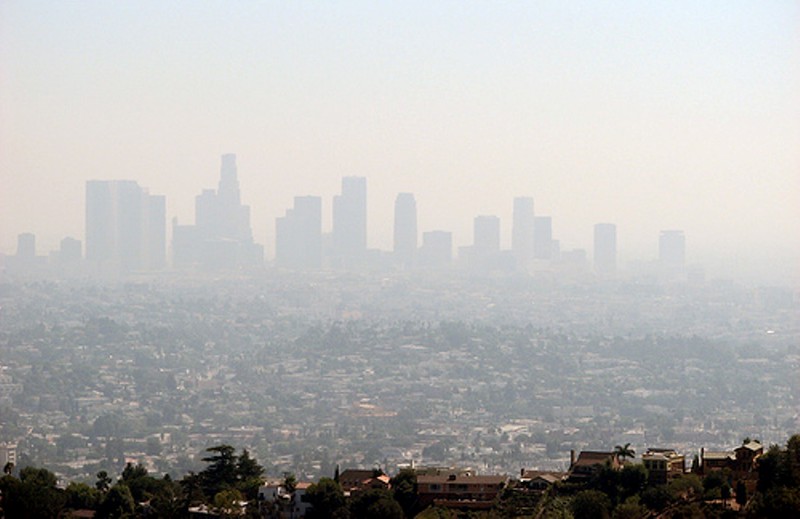
- Los Angeles-Long Beach-Anaheim, CA – 0.124
- Bakersfield, CA – 0.101
- Fresno, CA – 0.09
- Phoenix-Mesa-Scottsdale, AZ – 0.087
- Denver-Aurora-Lakewood, CO – 0.087
- Sacramento–Roseville–Arden-Arcade, CA – 0.086
- Madera, CA – 0.085
- Oxnard-Thousand Oaks-Ventura, CA – 0.085
- Hanford-Corcoran, CA – 0.084
The EPA maintains standards for ozone pollutants and measures a couple of different ways. The results are described in parts per million (ppm). To avoid anomalies, the EPA looks at the 4th highest daily max 8-hour average in the year and sets the standard at 0.07 ppm. All of the top 10 are well beyond that mark and a whopping 70 U.S. cities are above that EPA standard.
Interactive Maps Made Easy
Sign Up NowRiverside-San Bernardino-Ontario, California area is the dirtiest city in America, at least where smog is concerned. But this isn’t the only Golden State location with abysmally high ozone levels. Home to eight of the top locations, including the four highest, California is one of the most polluted states in the US—and it’s also in the country’s dirtiest region.
Continuing the trend in the western U.S., the Denver-Aurora-Lakewood area ranks high in smog. As does the more southern of the same region (the Phoenix-Mesa-Scottsdale area). Breathing in either smog or soot can increase the risk of lower newborn birth weight, so let’s move on to the second most common air pollutant.
US Cities with the Most Soot in the Air
When it comes to particle pollution (PM2.5, also known as soot), the EPA recommends no more than a 12 ug/m3 mean weighted by calendar quarter for the year. However, 23 cities across the U.S. surpass that—and ten cities’ particles are at far greater levels than the EPA advises, as you’ll see on the table below.
| City | State | PM2.5 Weighted Annual Mean (ug/m3) |
|---|---|---|
| Eugene | OR | 23.2 |
| Bakersfield | CA | 22.5 |
| San Diego-Carlsbad | CA | 20.5 |
| Fresno | CA | 20.3 |
| Hanford-Corcoran | CA | 19.9 |
| Madera | CA | 19.1 |
| Phoenix-Mesa-Scottsdale | AZ | 17.2 |
| Sacramento–Roseville–Arden-Arcade | CA | 16.1 |
| Chico | CA | 16 |
| Los Angeles-Long Beach-Anaheim | CA | 15.9 |
Once again, Californian cities dominate the charts. Eight of the sootiest are located in California, including many of the top smoggiest cities we mentioned earlier (Bakersfield, Fresno, Hanford-Corcoran, Madera, Sacramento–Roseville–Arden-Arcade, and Los Angeles-Long Beach-Anaheim), along with new additions like San Diego-Carlsbad and Chico.
But none of these cities are #1. That title belongs to Eugene, Oregon, which is nearly double the EPA’s standards.
Find Cities with the Best Air Quality
On a higher note, there are also cities with air quality levels far better than the EPA’s recommendations on the map. Take ozone, of which Urban Honolulu, Hawaii and Santa Cruz-Watsonville, California have the best levels, .045 and .048 ppm, respectively.
The ozone levels of Keene, New Hampshire, Bellingham, Washington, and Claremont-Lebanon, New Hampshire-Vermont are similarly high (.050 ppm). Meanwhile, Minot, North Dakota’s .051 ppm is nearly as good, along with eight cities of .052 ppm, which you can find on the map.
The same goes for particle pollution, which the EPA advises no more than 12 ug/m3:
- Manchester-Nashua, NH – 3.00 ug/m3
- Dickinson, ND – 3.60
- Rock Springs, WY – 3.60
- Wilmington, NC – 3.70
- Urban Honolulu, HI – 3.90
- Laconia, NH – 4.10
- Claremont-Lebanon, NH-VT – 4.30
- Corning, NY – 4.40
- Brainerd, MN – 4.40
- Cambridge, MD – 4.40
- Brookings, SD – 4.40
You’ll notice Honolulu, Hawaii and Claremont-Lebanon, New Hampshire have some of the better levels of both smog and soot.
That’s it for the cities with the best and worst air pollution in the U.S. Switching gears from air to recycling, be sure to check out the Most and Least Environmentally Friendly Countries.
