US Cities Most Impacted by Rising Sea Levels
Climate change has many effects, from extreme weather events to habitat displacement and rising sea levels. As the Earth’s temperature rises, polar ice caps and glaciers melt, contributing to the increased volume of water in the world’s oceans. This phenomenon leads to the gradual encroachment of seawater onto coastal areas, posing a significant threat to numerous cities and communities worldwide.
This article examines which US locations are the most affected by rising sea levels. It starts by outlining the 10 cities with over half of their housing at risk.
View U.S. Cities Most Impacted By Sea Level Rise in a full screen map
Rising sea levels have impacted all 118 US cities on the map. Yet some are more affected than others, especially the top 10 with over half of their housing at risk:
- Miramar, FL
- Pembroke Pines, FL
- Davie , FL
- Hialeah, FL
- Fort Lauderdale, FL
- Miami Gardens, FL
- Hollywood, FL
- Norfolk, VA
- Hampton, VA
- Charleston, SC
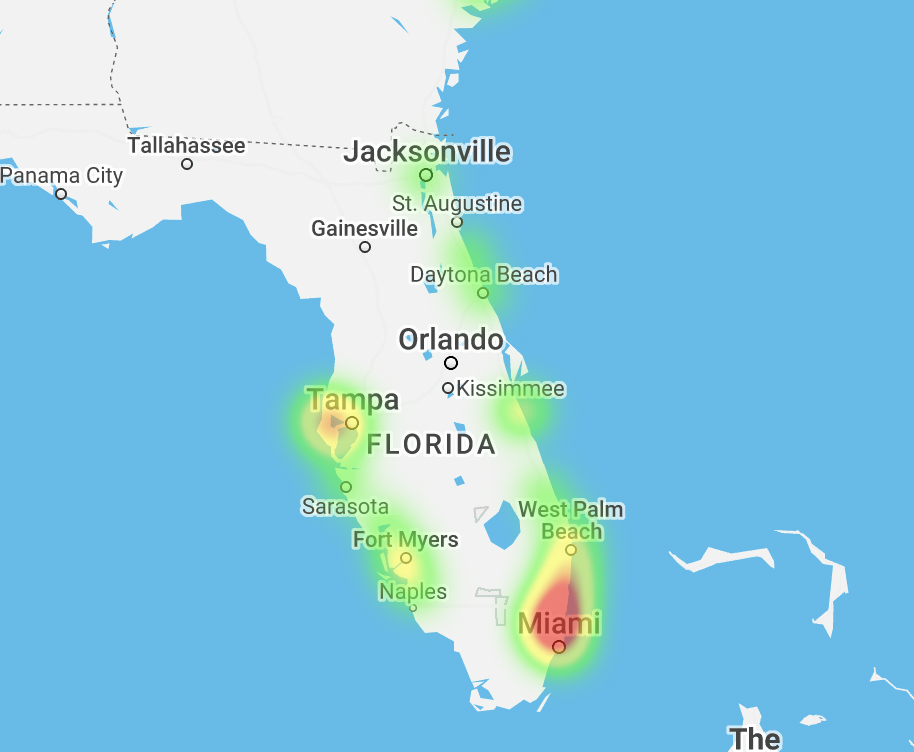
Miramar, Florida claims the top spot, with 95.2% of its housing units in vulnerable areas. Miramar is closely followed by Pembroke Pines, Davie, and Hialeah, all in Florida, with 94.5%, 91.8%, and 90.7%, respectively.
Also in Florida, Fort Lauderdale, Miami Gardens, and Hollywood face considerable risk. Cities beyond Florida are also experiencing increased vulnerability (Norfolk, VA, Hampton, VA, and Charleston, SC), though Florida remains the most at-risk state.
Change in Houses at Risk between 2019 & 2020
To give a clearer picture of housing at risk due to rising sea levels, we next turn to the most significant increases—or decreases—between 2019 and 2020.
| City | State | Change in % of houses in risk zones from 2019 to 2020 (%) |
|---|---|---|
| Cape Coral | FL | 28.5 |
| Davie | FL | 27.8 |
| Hialeah | FL | 26.2 |
| Norfolk | VA | 25 |
| Hampton | VA | 19.5 |
| Jersey City | NJ | 15.1 |
| Hollywood | FL | 14.7 |
| Virginia Beach | VA | 12.3 |
| Fort Lauderdale | FL | 12.2 |
| Pompano Beach | FL | 12.1 |
Interactive Maps Made Easy
Sign Up NowIn several Florida cities, namely Cape Coral, Davie, Hialeah, Hollywood, Fort Lauderdale, and Pompano Beach, the percentage increases of risk range from 12.1% to 28.5%. Many of these cities may be familiar, as they also appeared in the top 10.
The only decrease was noted in Bellevue, Washington. In 2019, the city’s share of housing units in risk zones was 0.2%. One year later, in 2020, that share was 0.1%.
The Most Affected States
As you could probably guess after seeing the top 10 and largest changes, Florida is the state where rising sea levels will have the most impact. The list below shows how many cities are affected in the Sunshine State, as well as the next five states that have the most cities affected:
- Florida — 33 cities affected
- California — 26
- Virginia — 9
- Texas — 7
- Massachusetts — 6
- Washington — 5
Beyond having seven cities in the top 10, Florida leads with 33 affected cities concentrated in its southeast region.
California follows Florida, with 26 cities at risk.
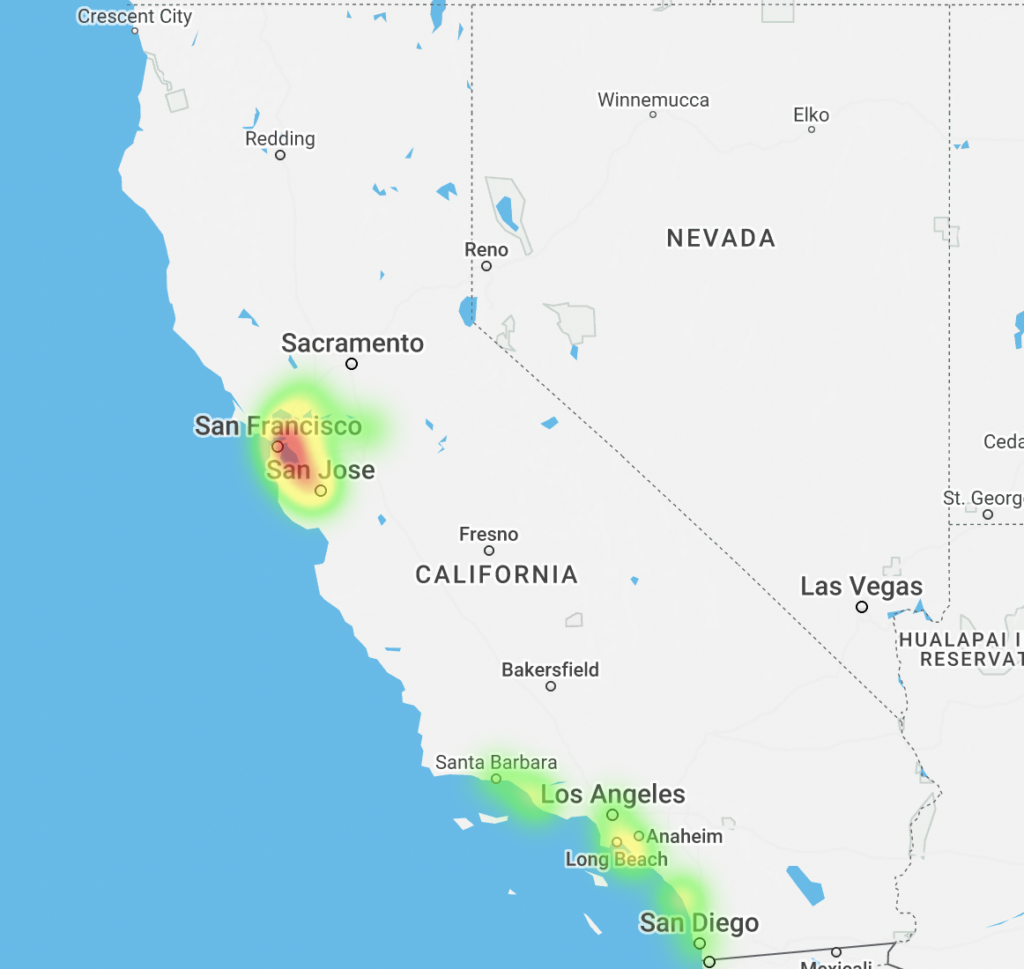
And though Virginia, Texas, Massachusetts, and Washington have fewer cities at risk, they’re far from being in the clear.
Visualizing the Density of Affected Cities
It can be difficult to truly understand the impact of rising sea levels in states that have many cities affected. Map markers can overlap, obscuring the view. This is where a heat map can be invaluable—and BatchGeo Pro users have access to exactly that with “Heat View.”
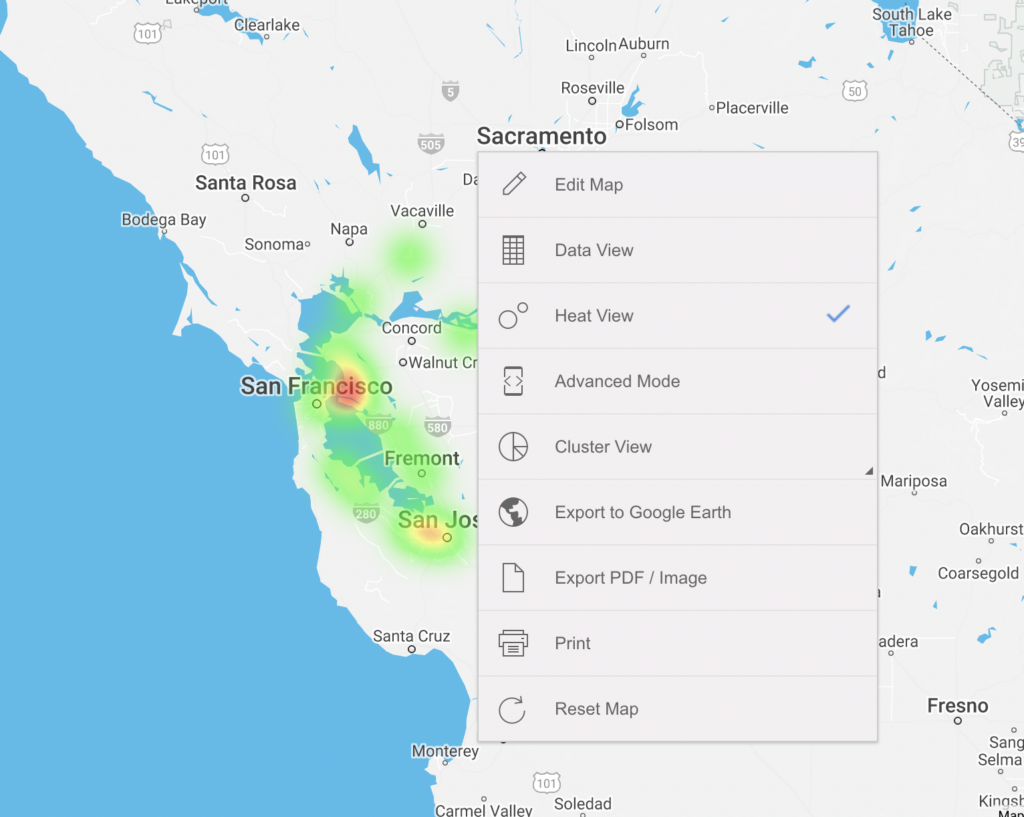
Here’s how to do it:
- Navigate to your map
- Right-click to toggle on “Heat View”
It’s the best way to visualize the density of locations and uncover the story within your data.
Try it for yourself with BatchGeo Pro.
