Google Maps and GIS Data Demystified

The physical world is a complex place. It’s no wonder that there are so many ways to describe it using geographic data. But that data itself can be quite difficult to understand, with each format a little (or a lot) different from the others. We’ve compiled the most common data file types for GIS and other mapping data. We’ll explain how you would use each type, how you might convert them, and how they help you build a map.

Shapefile: SHP, SHX, DBF, PRJ

Shapefile is a popular format for geographic data originally defined by Esri, the company behind ArcGIS and other GIS software. The singular “shapefile” is a misnomer, as there are actually multiple files needed to describe the geographic data in a shapefile. For every shapefile, at least three files are required:

  • .shp is what gives it the name shapefile and where the geometric features are described, such as lines, points, and polygons.
  • .shx is an index of the .shp file data, compiled into a binary format which makes it easier for applications like ArcGIS to access the data.
  • .dbf is a database format that contains additional data that is not necessarily geographic, such as names/labels for your shapes.

While not required, another common file is .prj, which contains the projection details. This file describes how to convert three dimensional data (i.e., shapes on the earth) to a two dimensional representation.

by Aaron Parecki
by Aaron Parecki

And there’s more. Shapefiles can contain any of these files: .ain, .aih, .atx, .cpg, .ixs, .mxs, .qix, .shp.xml

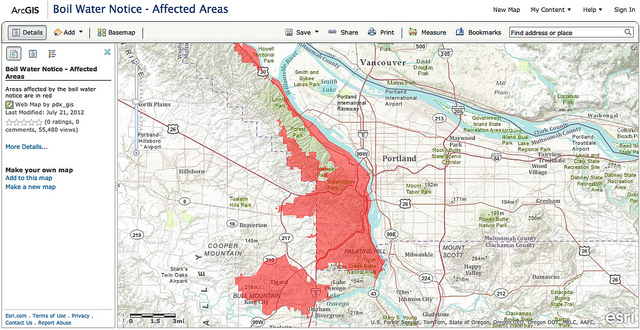
To read shapefiles, you need software that understands the format. Several Esri products in the ArcGIS suite of desktop software support shapefiles, including the free ArcGIS Explorer. There is also an open source geographic data editor, QGIS, which can read and write shapefiles.

Keyhole Markup: KML, KMZ

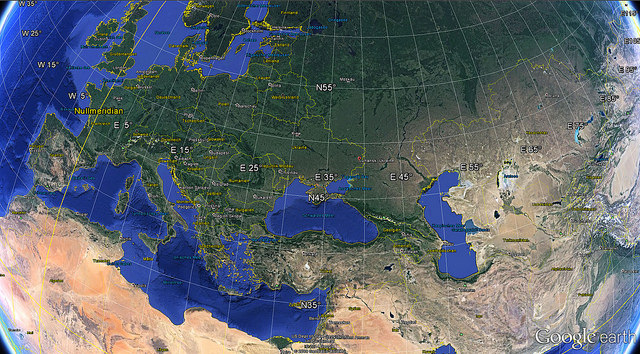
Before there was Google Maps, there was Google Earth. And before Google Earth, there was Earth Viewer, made by Keyhole, Inc., later acquired by Google. Earth View became Google Earth, and the Keyhole Markup Language became a popular format for describing geographic data.

by Karl-Ludwig Poggemann

KML, used in .kml files, is an XML-based data format. It’s moderately human readable, since XML is written in plain text. For example, here’s a single point on a map, along with some metadata associated with the location:

<Placemark>
     <name>Paris</name>
     <Point>
          <coordinates>2.3522219,48.856614,0</coordinates>
     </Point>
     <ExtendedData>
       <Data name='Flag'>
       <value>http://upload.wikimedia.org/wikipedia/en/thumb/c/c3/Flag_of_France.svg/23px-Flag_of_France.svg.png</value>
          </Data>
          <Data name='Continent'>
               <value>Europe</value>
          </Data>
  </ExtendedData>
</Placemark>

You can create KML files with BatchGeo that have many locations and can be loaded into Google Earth or other geographic software. In addition to points, KML can include lines and shapes, as well.

Convert KMZ to KML

KMZ files, with the .kmz extension, is a compressed version of KML. It’s a binary format meant to increase the efficiency of sharing KML files, since the size is significantly smaller.

To convert KMZ to KML:

  1. Rename filename.kmz to filename.zip
  2. Decompress the file like you would other ZIP files (usually you can just double click).

After decompressing, you should have a KML file (it may be inside a directory/folder).

GPS formats: GPX, GPI, etc.

A common way to generate geographic data is with a GPS device, such as Garmin, Magellan, or even a smart phone. While the output formats vary greatly, they typically describe points or lines. For individual locations, you may need to save them periodically (sometimes called waypoints). Most commonly, the entire route will be stored as a series of points.

GPX files, with a .gpx extension, is the most common of the many GPS data output formats. Like KML, it is based on XML, so it is text-based markup. GPX can contain both waypoints and tracks/routes. For tracks, there will be multiple points that describe the route. That portion of the GPX file will look something like this:

<trk>
  <name>Golden Gate Bridge Welcome Center to Vista Point</name>
  <number>1</number>
  <trkseg>
  <trkpt lat="37.8077333" lon="-122.4750286">
    <name>TP001</name>
  </trkpt>
  <trkpt lat="37.80771" lon="-122.47502">
    <name>TP002</name>
  </trkpt>
  <trkpt lat="37.8077" lon="-122.47502">
    <name>TP003</name>
  </trkpt>
  ...
  </trkseg>
</trk>

GPX is often used to track and share a certain route, such as a hike or run. It’s also the format accepted by OpenStreetMap, a community that has used GPS traces to create a map of the world.

GPI, with a .gpi extension is a Garmin file format. It’s one of many formats that OpenStreetMap recommends converting to GPX. You can see all the GPS trace formats on the OpenStreetMap site.

Spreadsheets: XLS, CSV

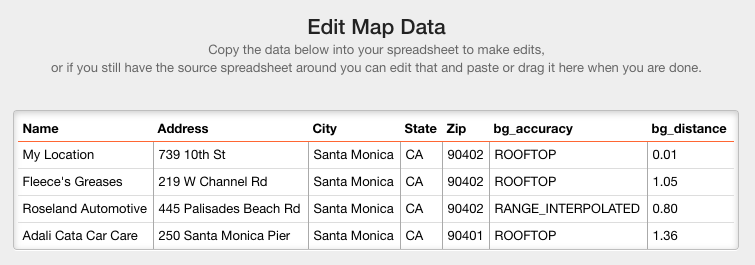
Geographic data may not be the first thing you think of when it comes to spreadsheets and other tabular data formats. That said, a spreadsheet is one of the easiest files to share and remains very human-readable. For that reason, you’ll often find location data stored in Excel, Numbers, Google Sheets, or other spreadsheet formats. Alternatively, spreadsheet-equivalent formats like CSV or tab-delimited files are a way to store data without requiring a specific spreadsheet application. These can typically be imported as a spreadsheet.

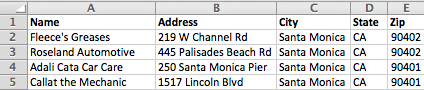
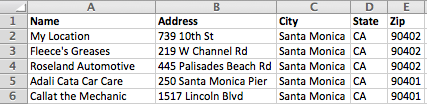
Unlike other formats that are specific to geographic data, there is no schema for how locations are stored in spreadsheets. Among the conventions, however, are to have separate columns for levels of data. For example:

  • Address
  • City
  • State of Province
  • Country

These can be turned into geographic data by geocoding the address or location data. Some geocoders require the individual location pieces, while others want a single field.

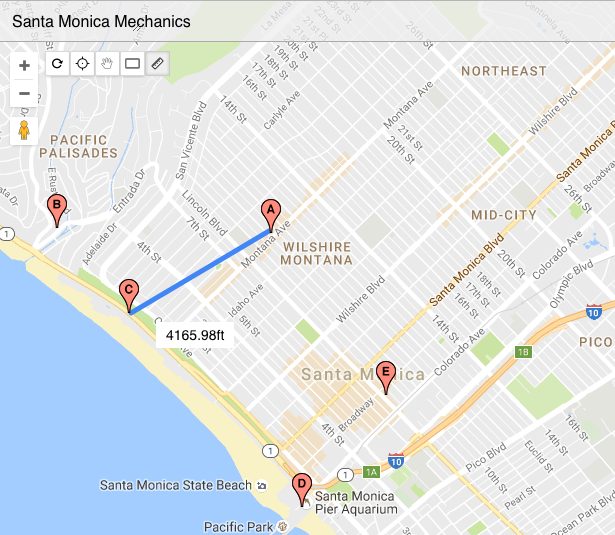
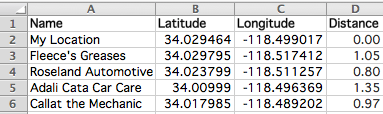
Other methods of storing geographic data are to store latitude and longitude coordinates directly, usually in two columns.

Map Your Spreadsheets

BatchGeo makes it easy to create a map from your spreadsheets using our mapping tool. Or follow this step by step excel mapping tutorial.

How to Enter Latitude and Longitude into Google Maps

Every point on the earth can be described by two numbers, neither larger than 180. Most of us even have devices that will tell us the exact point where we’re standing. The set of numbers are coordinates, referred to as latitude and longitude. Alone these numbers aren’t particularly useful. We instead want to add them to a map. There are many ways to enter latitude and longitude into Google Maps and other online maps. We’ll cover many of them below and even help you discover where you can find some coordinates to try it out yourself.

For now, let’s say you have a latitude and longitude and you’re ready to see it on a Google Map.

Use Google Search

Google Maps display of latitude and longitude coordinates
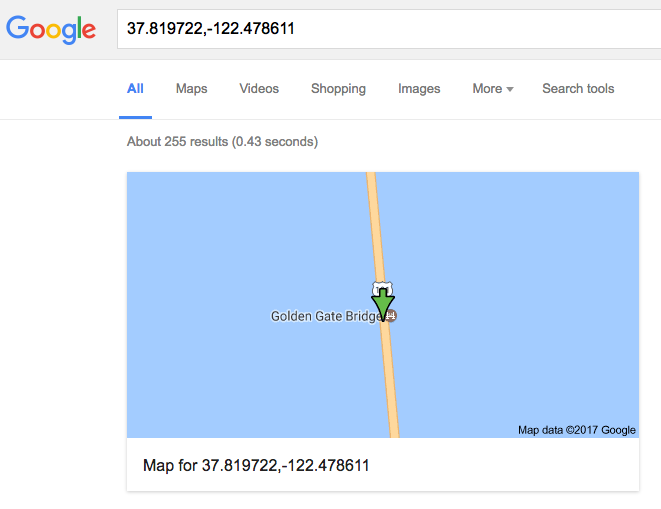
That’s right, you can go straight to the simplest page on the Internet—google.com—and enter your latitude and longitude into the search box. Usually coordinates are listed with latitude first, then longitude. Double check that is the case and that you’ve included a comma between the numbers.

Let’s say these are your coordinates: 37.819722,-122.478611

At the top of the search results, you’ll see an image representing those coordinates on a map. In this case, that’s somewhere along the iconic Golden Gate Bridge in San Francisco! Click the image and you’ll be taken to the full Google Maps version of the same location. There’s a single map marker at the location you searched.

In fact, you can go directly to Google Maps and use its search. You can even get directions from one set of coordinates to another. Google Maps treats latitude and longitude like any other search term, allowing you to specify the exact location.

You can even link to Google Maps by latitude and longitude point. For example, here’s the quickest way to the map at the Golden Gate coordinates:
https://www.google.com/maps?q=37.819722,-122.478611

Including more than one or two markers on a map is a bit more complex. Before we get to that, where do you find all these coordinates to map in the first place?

Find Latitude and Longitude Points

Before you can put latitude and longitude on a Google Map, you need to find the numbers. Once you start looking out for them, you may notice them all over the place. Any time you use maps or other location apps on your smart phone, there are latitudes and longitudes under the covers, for example.

You can get a GPS app for your phone that will show your current location. To be the most readily useful, ensure you can receive the coordinates in decimal notation. Often, a GPS app (such as iPhone’s Compass app) will display in degrees. To be ready for Google Maps, you’ll probably have to convert those coordinates, so it’s best to find an app that has them ready as a pair of decimal numbers.

Wikipedia example of latitude and longitude coordinates

A great way to find latitude and longitude points without having to visit the location is to use Wikipedia. Most articles for cities, places, and landmarks have the coordinates listed in the upper right of the page. By convention, Wikipedia shows these in degree notation. However, click the coordinates and you’ll be taken to a page that provides the decimal conversion.

Lastly, Google provides this tool, embedded below

You can enter an address, postal code, landmark, or other location and get its latitude and longitude values. You can even explore a map, find the spot you want, and click. Try it above.

Create a Google Map Listing Many Locations

It’s one thing to plot a single point on a map or to discover the coordinates for all your favorite places. Next you need to get them all on a map. For programmers, Google includes a Google Maps API. As we discuss in our tutorial, that’s definitely the hard way to map multiple locations.

Most users of our mapping tool simply have a spreadsheet with addresses. Simply copy and paste the entire spreadsheet and we’ll create a map that you can view online, embed in your website, and share with others.

The tool also works with latitude and longitude points. Just include them as two columns in your spreadsheet, then copy and paste all your data in. We created a more detailed walkthrough of mapping latitude and longitude points using BatchGeo, which goes through the process step by step.

Are you ready to try it out? Create your first map right now.

Calculate Distances Between Two Addresses or Points

The shortest distance between two points is a straight line, but how long is that line? When it comes to those two points, you may know them as GPS coordinates, or you may only have addresses. Even if you know each latitude and longitude, the math behind the distance calculation is complicated. There are several approaches and tools you can use to make it easier, even bringing the calculations to every row of a spreadsheet. We’ll cover a few options below to get you started with calculating distances.

Many Distances from a Single Place

Calculating a single distance is easy. In fact, we do it all the time using Google Maps and other directions services. Of course, that distance is typically a driving distance instead of the straight line distance. Nevertheless, when you find yourself needing to know multiple distances, the most common reason is you want to find out which locations are closest to single point, such as your current location.

Let’s say you have a spreadsheet of addresses of your city’s mechanics. Your car is broken down and you don’t want to have to push or tow it any farther than necessary.

Santa Monica Mechanics

Add your address, or the address of wherever you want to use as a reference location in the first row of your spreadsheet, just after the header row.

Santa Monica Mechanics (with my location)

Now highlight and copy your entire spreadsheet (including the header row) and paste it into our simple map making tool. Click Validate and Set Options, then choose Advanced Options. Check the option to calculate distance from the first address. Then click Make Map.

View Santa Monica Mechanics in a full screen map

Now when you see the map, the distance is listed along with the other data with each marker. Since we used letters to label the markers, we know that Marker A is our first row, which is used to calculate the distance for all the other markers.

Break Out Your Digital Measuring Tape

Calculating the distance across all your locations is incredibly useful. Yet, sometimes you want to perform ad hoc measurements between many markers. That’s where the measuring tools that are part of BatchGeo’s Advanced Mode come in handy.

You can check whether Advanced Mode is active, and activate it if necessary, using the Pro menu in the upper right corner of any map. You must be a BatchGeo Pro member and logged in to use Advanced Mode. If Advanced Mode is active, you’ll see several buttons near the zoom controls in the upper left corner of your map.

Manually measure distances

Select the measuring tool, the button with a ruler icon. The hand cursor will become a plus sign target. Now click and hold where you want to begin a measurement (such as one of the markers). Next, drag the cursor to the end of your measurement. As you drag, you’ll see the current distance from the initial point to the current cursor. To switch between metric and imperial systems, click the scale on the bottom right of the map.

Deploy the Haversine Formula in Your Spreadsheet

The absolute best way to view geographic data is from a map, which is why BatchGeo lets you map Excel data (and other spreadsheets) with our simple copy-paste interface. However, if you need the distances in your spreadsheet directly, you’ll need to include a complex series of functions.

Santa Monica Mechanics (with distances)

Let’s say you know the latitude and longitude points of those mechanics stored in columns B (latitude) and C (longitude) of your spreadsheet. Using a formula derived from this site, you could calculate the distance from Fleece’s Greases (row 3) to your location (row 2) using this formula:

=3958*ACOS(SIN(B$2*PI()/180)*SIN(B3*PI()/180) + COS(B$2*PI()/180)*COS(B3*PI()/180)*COS(C3*PI()/180-C$2*PI()/180))

You can change the 3,958 — the approximate radius of the earth in miles — to another unit, such as kilometers (6,371), meters (6,371,000), or feet (20,898,240). The rest is advanced math based on the spherical law of cosines. The important parts are the B$2 and C$2, which ensure you’ll compare other rows in the spreadsheet to your location, affixed in that second row. When you copy and paste this formula, the other fields will update to correctly reference the current row.

The haversine formula only works if you know your latitude and longitude points. If all you have is addresses, BatchGeo can help: create a map with measurements from a single distance (as in the first section above), and copy the data back out to your spreadsheet. Go to edit your map, copy the entire data, and you’ll see the distance as the final column when you paste into an empty spreadsheet.

Edit Map Data to Get Distances

The best part is that your map will still be there as a visual representation of the same data. Naturally, we think a map is a great way to augment the data in your spreadsheet. These different methods of calculating distances have varied levels of difficulty and usefulness, depending on the data you have available. Why not try creating a map now for free?