Make a Map with a Google Sheets Geo Chart
We all know that Google Sheets is great for storing and analyzing data. Some spreadsheets can contain geographic location information such as addresses or latitude and longitude coordinates. These can show sales stats, leads, or even wedding planning information.
There are plenty of ways Excel’s web-based competitor can help you display key location details. For example, you can sort a sheet of cities or states from A to Z, use conditional formatting to highlight duplicate entries, or summarize columns with pivot tables.
While many of these methods can help you visualize your location data, only a map offers the level of insight you’re likely looking for. The good news is you can make a Google Sheets map (what they call a geo chart)— all without leaving the platform.
Geo Chart Your Country, Continent, or Region Data
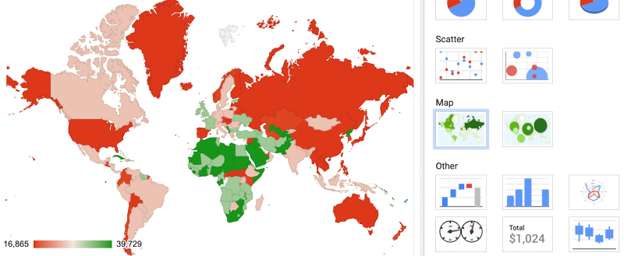
You no doubt had to make a few bar graphs or charts in grade school. However, there are more charts than just the bar variety. Google Sheets recognizes eight types of charts with 32 options in total, including two geo charts, one with markers and one without.
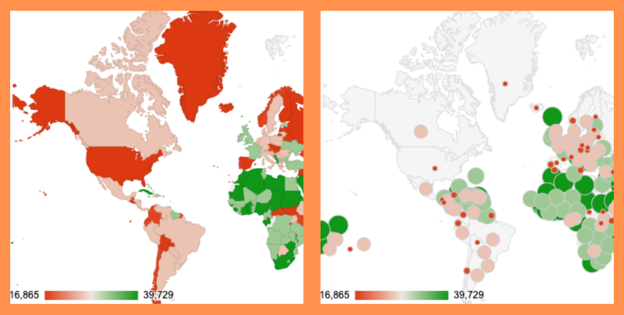
 A geo chart
A geo chart with markers
You can use these two types of geo charts to create maps from your data in Google Sheets. Both note that these only work with:
- latitude and longitude
- regional data (continents, countries, or states)
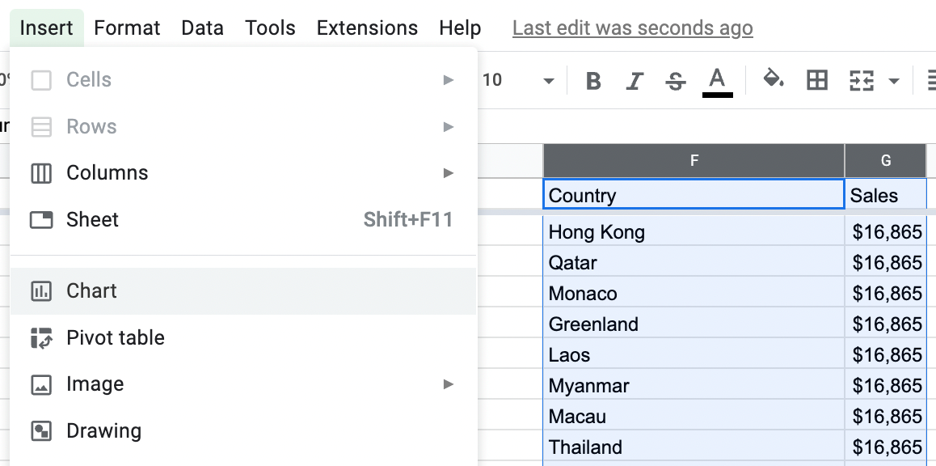
Using a spreadsheet that contains sales data by country, here’s how to create a geo chart:
- Open your spreadsheet in Google Sheets
- Format your data
- First column: continents, countries, states, or latitude
- Second column: numeric data or longitude
- Select the cells you want to include on your geo chart
- Click Insert > Chart
- Under Chart type, scroll until you see the two Map options and make your pick. Note that for the map with markers, the data for each location defines marker size.
With the basics of your geo chart set, you can now customize your map.
Customize Your Geo Chart with Colors
Whether it’s country sales or an inmate population, ensure your map chart highlights your data with customizations.
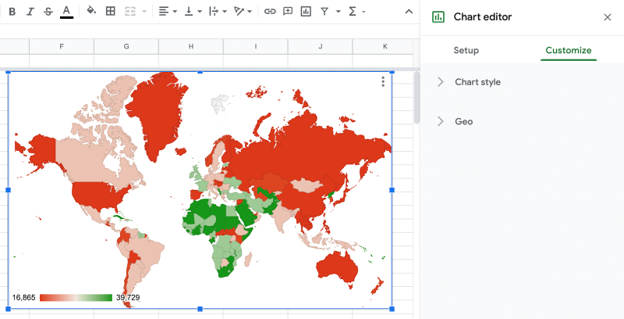
Double-click your geo chart or select the three dots in the upper right corner of your chart and click Edit chart. Then, choose the Customize tab.
Interactive Maps Made Easy
Sign Up Now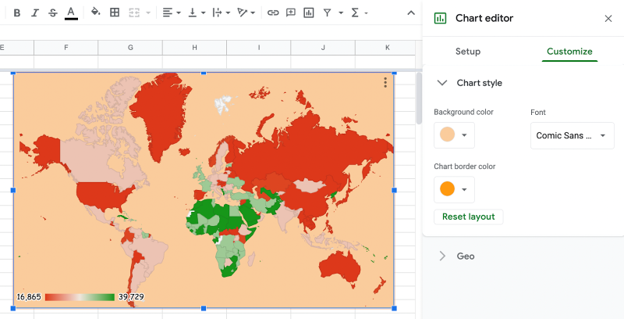
You can adjust your Chart style, including Background color, Chart border color, and Font.
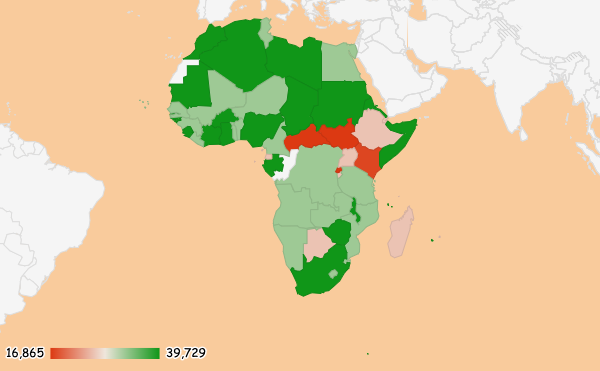
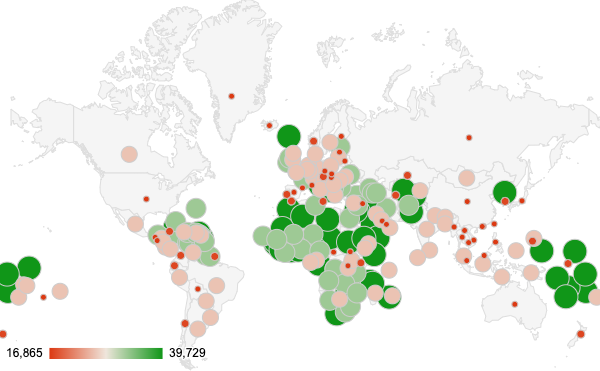
Geo chart Region: Africa
You can also change your chart’s Geo elements, like the Region. The World view is the default. Choosing a Region will zoom in on that location in the geo chart, focusing on the data you want to see most.
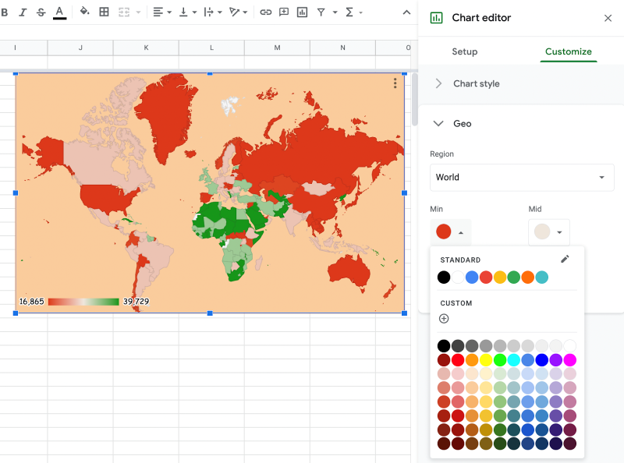
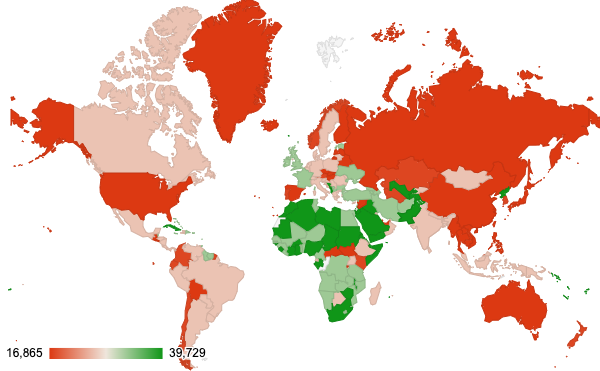
Also within the Geo dropdown, you can adjust the color of the Min, Max, and Mid data values. By default, the Max data ($39,729 in sales) for country sales is denoted in green, while Min sales ($16,865) is in red.
This may be a great way to color-code sales data, but it may not be appropriate for other datasets. For example, you might want different color assignments on a geo chart of countries with the highest prison populations.
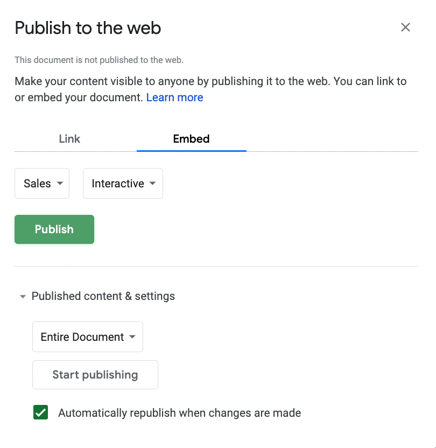
Navigating away from the Customize tab, you can resize your geo chart by dragging the edges in or out. Then, download or publish your chart to share on your website.
Creating, customizing, and sharing a geo chart in Google Sheets is simple enough and you have the benefit of remaining on the same platform as your data, but there are some downsides to keep in mind.
Cons of Map Charts In Google Sheets
The limitation of country, continent, or region data is the main drawback of geo charts. You’re out of luck if the data you want to display contains addresses, cities, states, or ZIP codes.
Another drawback is that, even if the locations associated with your data fit into Google Sheets’ mold, the platform can only show numeric data. This excludes numerous datasets with textual information.
Beyond that, a geo chart is a pretty basic map — and this isn’t just a Google Sheets issue. Even in Excel, there’s no heat map function or other insight essentials. Luckily, there’s an alternative that’s as easy as copy and paste.
Use a Tool Intended for Mapping
Google Sheets and other spreadsheet tools are for storing data and basic analysis — not for mapping. Instead, use tools dedicated to map-making.
There are many such tools out there, as we outlined in Introduction to Map Making on the Web: ArcGIS and other desktop GIS software, the Google Maps API, and web-based mapping tools such as BatchGeo.
Not only can BatchGeo map country, continent, and region data like Google Sheets, it can also identify common landmarks, addresses, cities, and ZIP codes. Check out the same country sales data we used in Google Sheets geo charts on our map below:
View Country sales in a full screen map
Along with more flexible location mapping, your numeric and textual data will be available for grouping. This is in addition to the many more ways you can get insights — including the ability to visualize the geographic density of your data with a heat map.
Get started with your own map today at batchgeo.com.
