How to Plot Latitude and Longitude on a Map
For hundreds—maybe thousands—of years, it was hard to make maps. People dedicated their entire lives to the craft. While that’s still true today, now there are tools that enable cartographers to share their work so others can build upon their maps. Most importantly, there is a coordinate system that makes it easy for ordinary people to understand and describe points on the earth. While latitude and longitude points have ben around for centuries, GPS and web maps have greatly enabled our ability to use them.
A Quick Latitude/Longitude Refresher
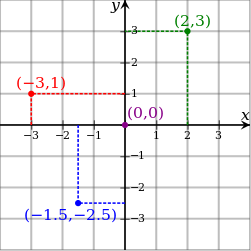
 Back in algebra class, you spent way too much time plotting points, lines, and expressions on a grid. These x/y graphs are a simple way to think of latitude (the y axis) and longitude (the x axis). Of course, the earth is not flat, nor even perfectly round, so the reality is more complex. But to make most maps, this is all you need to know.
Latitude of zero is along the equator. Using decimal notation, latitude extends north to 90 degrees and south to -90 degrees. Longitude doesn’t have an obvious zero marker, so the British made one up at the Greenwich Observatory in London. Everything due North and South of that point is zero longitude. To the east, the numbers increase until 180 degrees on the other side of the earth from London. To the west, the numbers decrease until -180 degrees meets 180 degrees in the middle of the ocean.
When we put latitude and longitude together, they form a pair of numbers that can be plotted on a map. For example, zero latitude and -78.455833 longitude is the Mitad del Mundo in Quito, Ecuador, a monument to “the middle of the earth.” If you go to 51.500833 latitude and -0.141944 longitude, you’ll find Buckingham Palace, across town from the Observatory (notice the near-zero longitude).
Often you’ll see decimal notation listed as a pair of coordinates separated by a comma. For example, San Francisco’s Golden Gate Bridge is at 37.819722,-122.478611. When working with coordinates, be sure that you know which number is listed first. You can do this by sanity checking a known location. In this case, you know San Francisco is in the western hemisphere and should have a negative longitude. Also, latitudes are never greater than 90, so that’s another hint here. We go into some greater detail on other ways coordinates are formatted in our latitude and longitude coordinates page.
Interactive Maps Made Easy
Sign Up NowMapping a List of Coordinates
Now that you have the basics of latitude and longitude down, let’s make a map! If you know how to code, you could use the Google Maps API directly. But that’s the hard way to make a map. Let’s look at what it takes to build a map from a simple spreadsheet.
Let’s say our spreadsheet looks something like this (your own version probably has many more rows):

Due to potential confusion over the order of coordinates, it’s a good idea to separate them out. Here’s a quick way to do that using Excel-compatible formulas:
- Add two new columns titled Latitude and Longitude

- To find the number to the left of the comma (latitude in our example), use the formula =LEFT(F2, FIND(“,”, F2)-1) where F2 is the first cell with the pair of coordinates. Then copy that formula down the column.

- To find the number to the right of the comma (longitude in our example), use the formula =RIGHT(F2, LEN(F2)-FIND(“,”, F2)) where F2 is the cell with the first pair of coordinates.

To account for the presence of a space after the comma, you can put a TRIM function around each of those formulas. But that’s optional. The important part is separating the coordinates.
View Example Latitude/Longitude Map in a full screen map
Now you can copy your spreadsheet rows, including the header, by highlighting and using the Ctrl+C command (Cmd+C on Mac) to copy it to your clipboard. Now, go to this map-making tool and paste (Ctrl+V, or Cmd+V on Mac) your spreadsheet data into the box. The result is a beautiful web map like the one above, ready to be saved and shared.
Use Geocoding to Find Coordinates of Addresses
If you don’t already have latitude and longitude points for your data, you can use our batch geocoding tool. You can convert addresses, postal codes, city names, and even some landmarks into coordinates and plot them on a map. Just copy and paste your spreadsheet data into the box.
