Category: mapping

Where Do Rich People Live?

Whenever the stock market fluctuates wildly in any direction you’ll read about people’s fortunes changing in a single day by what most of us will not make in a lifetime. Despite the wealth we can hardly understand, these billionaires do not each live on their own private island. In fact, most are in major cities around the world, often close to their business interests. The map below shows the hometowns of the world’s richest, according to the annual Forbes list.

View Cities with the Most Billionaires in a full screen map

This map may look a little different than the usual list you expect from Forbes. Where are Bill Gates, Carlos Slim, Warren Buffett, and others? They live in cities that are otherwise unpopular with their fellow billionaires. In fact, Forbes notes that these 20 cities are home to more than one-third of the world’s billionaires. But that leaves 1,181 of the richest that live elsewhere.

Gates lives in the Seattle, Washington, area, which does not have the 14 other billionaires, so his hometown misses this map, as does Slim’s Mexico City, and Buffett’s Lincoln, Nebraska. The cities that do make this map are internationally recognizable, from New York City (#1, 78 billionaires) to Jakarta (#20, 15 billionaires).

New York is to be expected, long the center of the world’s financial markets. Its counterpart across the Atlantic, London, is #4, with 46 billionaires. Between the two are the emerging powerhouses of Moscow (68) and Hong Kong (64). Rounding out the top five is Beijing (45), nipping at London’s heals.

The representatives from those cities may be faces you’re less familiar with. Certainly the Koch brothers of New York are perennial top 10s. But have you heard of Murat Ülker? The owner of a Turkish food conglomerate, Ülker has a net worth of $4.4 billion and a Wikipedia page with a biography of fewer than 100 words.

Similarly, Facebook co-founder Dustin Moskovitz does not have the household name of Mark Zuckerberg, but Moskovitz is the richest person in San Francisco. Here is the full list of the top 20 cities that the rich call home, along with the most affluent resident.

Rank City Billionaires Richest Net worth Source
1 New York, New York 78 David Koch $42.9 B diversified
2 Moscow, Russia 68 Vladimir Potanin $15.4 B metals
3 Hong Kong 64 Li Ka-shing $33.3 B diversified
4 London, United Kingdom 46 Len Blavatnik $20.2 B diversified
5 Beijing, China 45 Wang Jianlin $24.2 B real estate
6 Mumbai, India 33 Mukesh Ambani $21 B petrochemicals, oil & gas
7 Seoul, South Korea 29 Lee Kun-Hee $11.3 B electronics/insurance
8 Istanbul, Turkey 28 Murat Ulker $4.4 B food manufacturing
9 Paris, France 27 Liliane Bettencourt & family $40.1 B L’Oreal
10 San Francisco, California 26 Dustin Moskovitz $7.9 B Facebook
11 Sao Paul, Brazil 25 Jorge Paulo Lemann $25 B beer
11 Shenzhen, China 25 Ma Huateng $16.1 B internet media
13 Taipei, Taiwan 24 Terry Gou $6.1 B electronics
14 Los Angeles, California 22 Patrick Soon-Shiong $12.2 B pharmaceuticals
14 Singapore 22 Robert & Philip Ng $9.6 B real estate
16 Shanghai, China 19 Tsai Eng-Meng $8.9 B food, beverages
17 Delhi, India 17 Shiv Nadar $14.8 B information technology
18 Dallas, Texas 16 Andrew Beal $11.7 B banks, real estate
18 Tokyo, Japan 16 Tadashi Yanai & family $20.2 B retail
20 Jakarta, Indonesia 15 Chairul Tanjung $4.3 B diversified

If you’d like to see the ways to visualize the data above on BatchGeo, you can create a map like the one above by simply copying the figures above into our map making tool. Or keep exploring money makers with this map of US incomes, though you’ll find those numbers a bit smaller than the billionaires discussed above.

Where Are the World’s Tallest Buildings?

Right now in Guangzhou, China, workers are constructing the CTF Finance Centre, which is already considered in the top five tallest buildings in the world. It is due to open in 2016 as a shopping mall, offices, residences, hotel, and, observation deck. China is home to one-third of the 100 tallest buildings in the world, all of which are plotted in the map below. You can see the “hot” regions due to BatchGeo’s clustering feature. In addition to rank, you can explore the buildings by height in feet, meters, and number of floors. Further, you can check out the years they were built, though as you’ll see later, that’s a young building’s game.

View Tallest Buildings in the World in a full screen map

Second to China for the share of the world’s tallest buildings is the United Arab Emirates. Most of those buildings, the first of which was built in just 1999, are in the luxurious, ultramodern Dubai. That city is also home to the very tallest building in the world, the Khalifa Tower, which opened in 2010. Five others of the top 100 are in UAE’s capital of Abu Dhabi.

Tallest Buildings

Third on the list is the United States, which was previously a tall building superpower. From 1930 until 1998, a building in the US held the distinction as tallest in the world. First the Chrysler Building in New York City, though it was surpassed the next year by the Empire State Building. The Sears Tower, now Willis Tower, in Chicago took the crown in 1974.

For a brief time in 1973, the original World Trade Center buildings in New York were the tallest. If they still stood, they would both make the top 20, despite the many buildings that have been built in recent years. One World Trade Center, built at the site of the former buildings, is now the tallest in the United States, fourth in the world. It was completed in 2014.

Building ever-taller structures relies on advancements in industrial technologies. That any buildings from the 1930s still make the top 100 list is a feat itself, let alone that the Empire State Building is still #14. As you can see from the interactive chart above, this list favors buildings constructed in recent years.

And that’s a pretty conservative definition of recent. There are over four years left in the current decade and already two-thirds of the world’s tallest buildings were built during that timeframe. Another 20 were built in the 2000s. In fact, only nine of the tallest buildings were built before 1990.

Map of Top Colleges in the US

As teenagers return to school in the US, those in their final year of high school will be thinking about where to apply for college. A lot of factors go into what university is a good match for students, and you’ll see plenty of lists that rank them. The map below is based on data from US News about what it calls National Universities. With the top 100 mapped, you can use BatchGeo’s grouping functionality to drill down on what you want to find.

View Top Universities in the US in a full screen map

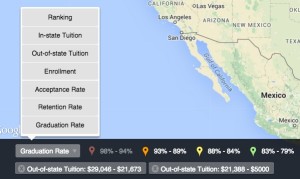
The map is initially grouped by ranking, and we’ve automatically provided ranges for you to select if you want to restrict to only the top or bottom universities. Of course, to make the list, they all have to be pretty good. Choose the menu in the lower left of the map to select other data from the list, including in-state tuition (same as out-of-state for private schools), out-of-state tuition, enrollment (number of students), acceptance rate, retention rate (freshmen who return), and graduation rate (undergraduates who graduate within six years).

You can select a couple groups of one type, then switch types to further restrict the map. For example, click top two ranking groups to see those in the top 11. Then switch to Acceptance Rate. All but two groups will be faded, which tells us that the top 11 does not accept more than 20.4% of applicants (in fact, click through the markers and you’ll see that Duke University, #8, has the highest acceptance rate of the top 11 with 12.4%).

Inexpensive colleges with high graduation ratesPerhaps exclusivity is not your thing. Click the group selector to clear your selections, then choose the Out-of-state tuition option. This provides the best apples-to-apples comparison for the cost of college, because in-state tuition typically has strict resident requirements. Choose the lowest three tuition ranges to see all the universities with less than about $30,000 annual cost.

Now, let’s make sure you have the best chance of a speedy graduation. Select Graduation Rate and the markers will switch colors based upon the range to which they belong. The best graduation rate is faded out, but select the second best and you’ll be left with two affordable universities with 90%+ graduation rates: University of California at Berkeley, and University of North Carolina at Chapel Hill.

This map view of top colleges is also useful for the student who wants to get very, very far from their parents. Just identify your home region on the map, then find a marker that isn’t close. For the parents, who want to keep their kids close, we actually have a special tool. Type your home town into the search bar above the map, press enter, and be whisked away to your nearest top school. This built-in feature allows BatchGeo customers to create a store locator tool, but here it does double duty as a school locator. It even works in tandem with the grouping feature, so you could find your closest university with under 13,000 students, for example.

There’s plenty more you can accomplish by exploring the different group types on the map. If you want to create your own map (for colleges or otherwise), we can help you, too. This top college data started as an Excel spreadsheet. What other data do you have in spreadsheets that could be transformed through a web map? Try BatchGeo now.