Two Ways to Map Your Running Route

What do you consider a “tool?” Certainly, a hammer or a screwdriver counts—but so does a pencil or even a how-to blog post.

If you’re a runner or even a biker, you may rely on a lot of tools: running shoes, a water bottle, a stopwatch, etc. You may also use a tool such as an app to track your routes. Thousands of these exist, from Komoot, Strava, and O.S. Maps.

While these apps often include a map, there may be times that you want to visualize your route in other formats—and perhaps you wish to share it with others. So let’s go over the two ways to map your running route, starting with track points.

#1 Map Your Track Points

The first way to map your running route involves exporting or downloading a GPX file of your entire tracked route (called track points in GPX terms) from your route-tracking app.

Once you have that file, you’ll need to export the coordinates into a list format to make your route usable. You can do this by diving into the XML yourself, or by finding a tool like this to convert to an Excel format. The result you’re looking for is a spreadsheet with separate columns for latitude and longitude, like this:
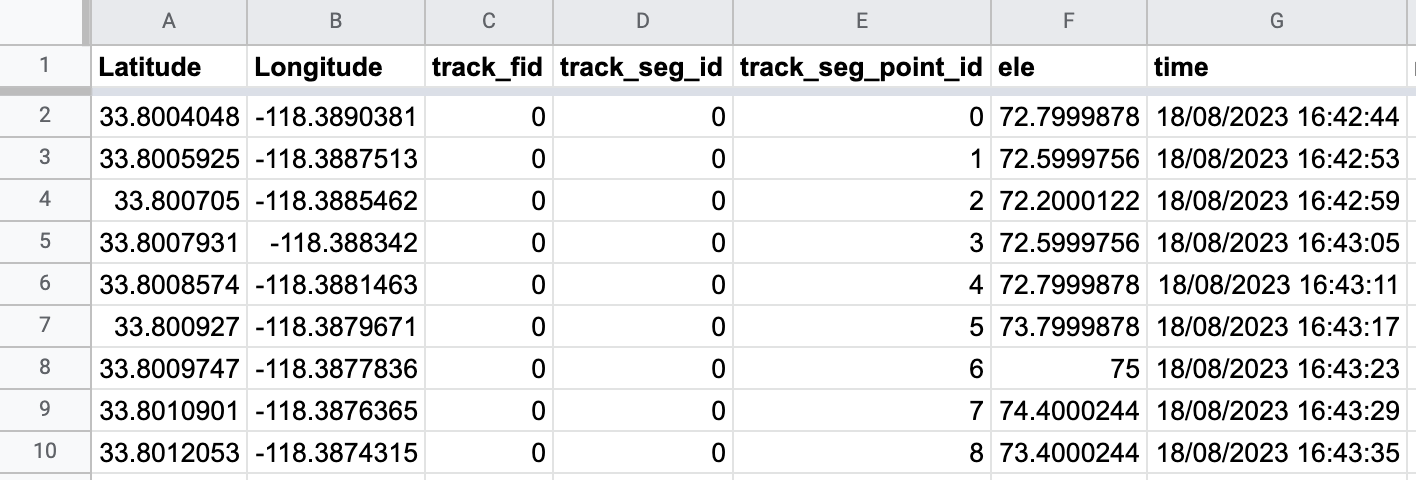
Track points Spreadsheet

You can remove certain columns from your spreadsheet, such as the “track_fid,” “track_seg_id,” and “track_seg_point_id” in the above example. We also recommend splitting dates and times into individual columns.

Then, follow these steps to map this spreadsheet data:

  1. Select (Ctrl+A or Cmd+A) and copy (Ctrl+C or Cmd+C) your data (including the headers)
  2. Open your web browser and navigate to batchgeo.com
  3. Click on the location data box with the example data in it, then paste (Ctrl+V or Cmd+V) your own data
  4. Check to make sure you have the proper location data columns available by clicking “Validate and Set Options”
  5. Select the proper location column from each drop-down
  6. Click “Make Map” and watch as the geocoder performs its process

Now you can see your route with a marker for every latitude/longitude pair in your GPX data:

View Your Running Route Trackpoints in a full screen map

However, if you’d prefer fewer markers on your map, the second method of mapping your running route may be for you.

#2 Only Map Your Waypoints or POIs

Depending on how many miles you run, a marker for every track point might be overwhelming on your map. So how can you narrow down your route? You can refer to waypoints or points of interest (POI), a feature of some GPS units or mobile location self-tracking apps that are shown separately from routes and tracks. These can be landmarks, fields, or even businesses you pass on your run.

If your app allows you to add and track these as you run, you can export or download this data and put it into spreadsheet form.

Then, you can follow the same steps noted above to copy and paste your spreadsheet data into batchgeo.com.

This way, you can plot your run by using the milestones you note along the way.

Label Your Route with Letters or Numbers

View Your Running Route Trackpoints, Labeled in a full screen map

Regardless of whether you prefer to highlight your track points or just points of interest, you can make your route map even easier to follow by giving each marker an alphabetical or numerical label.

Labels are best suited for maps with fewer locations (26 for alphabetical labels and 99 for numerical labels), which makes them perfect for your route—unless you’re running multi-day marathons.

By default, there are no labels for your markers, so we’ll need to indicate we want them. To do so in BatchGeo:

  • Right-click your map and select Edit Map
  • Scroll down to Set Options, then Show Advanced Options
  • Locate the “Label each marker” dropdown and select letters or numbers for your labels

Now you’re ready to share your easy-to-follow running route map with your friends and family. You can always copy and send the URL of your map—or even embed it seamlessly in your website or blog.

Happy running (and mapping!)

National Flowers and Trees, Mapped

Countries often choose national foods, drinks, animals, sports, and other symbols to celebrate and promote their unique identity and culture.

Then, there are plants, specifically flowers and trees. Yes, some countries have declared national flowers, like rhododendrons, roses, and orchids. Even more common are national trees, of which one stands alone, strong and powerful… kind of like an oak tree.

Let’s explore the 31 national flowers and 92 national trees of various nations.

View National flowers and trees in a full screen map

Rhododendrons, Roses, the Other 26 National Flowers

Flowers have long been used as symbols of a country’s identity and culture. When the 31 countries with national flowers made their decisions, they considered history, culture, and, of course, what was native to the nation.

Of 195 countries in the world, only 15% have declared a national flower. Yet, even still, we saw overlap in their choices: rhododendrons (3), roses (2), Lillies (2), poppies (2), and orchids (2) all were chosen by more than one country.

Rhododendrons

Rhododendrons are a symbol of resilience and strength, which may be why three countries selected them as their national flower. Nepal’s the Rhododendron arboreum, while both the Emirate of Caucasus and Kashmiristan choose the Rhododendron ponticum to represent them.

Roses are another popular choice for national flowers. Both England and the Maldives have selected types of roses for their national flower: the Tudor rose (an emblem) and Pink rose, respectively. Despite their names, neither South Korea’s Rose of Sharon nor Chile’s Lapageria rosea are roses. Like the rose, orchids are the national flower of two nations: Sikkim (Noble orchid) and Singapore (Orchid).

Meanwhile, lilies symbolize purity, innocence, and tranquility. You might think this makes them a popular national flower choice. While Sri Lanka’s Water Lily and Finland’s Lily of the Valley suggest this, the Lily of the Valley is a bit of a misnomer—it’s actually part of the asparagus family. Only Sri Lanka is truly represented by this particular type of flower.

Check out the rest of the national flowers on the map. Enjoy the simplicity of the Tiaré Flower (Cook Islands) or the bright bloom of Samoa’s Red ginger before moving on to national trees…

National Trees Are Overwhelmingly Oak

Oaks

Far more nations have designated national trees (92) than flowers (31). Also unlike national flowers, there’s a very common national tree: Oaks (18). Even so, there’s more than one Oak variety for nations to choose as their national tree.

National tree common name # Countries
Oak, Pedunculate oak 12 Belarus*, Croatia, Denmark, England, Estonia, Latvia, Lithuania, Moldova, Poland, Romania, Serbia, United Kingdom
Oak 2 Germany, United States
Sessile oak 2 Ireland, Wales
Cork oak 1 Portugal
Golden oak 1 Cyprus

The Pedunculate oak is the national tree of 11 countries—12 if you count Belarus, for which it is unofficial. All 12 are located throughout Europe, where this type of oak is native (it’s often referred to as the English oak or European oak).

However, not every European country is represented by the Pedunculate oak. Ireland and Wales’ national tree is the Sessile oak. Portugal has its Cork oak and geographically-Western-Asia yet culturally Southeastern European Cyprus chose the Golden oak. Meanwhile, Germany (and the U.S., though it’s decidedly not a European country) selected plain old oaks.

Palms, pines, and olive trees are also popular trees, as you can see in the table. You’ll find them all on the map… along with photos of each national flower or tree.

Display Images on Your Map

You may have noticed the thumbnail images we’ve included in this map, something you can do with your own BatchGeo custom map.

An image is worth a thousand words. That’s why we made it easy to include logos, icons, photos, or other imagery in your map itself.

Here’s how to do it:

  1. First, you’ll want to check that your images are small, not more than 150 pixels in either direction.
  2. Next, you’ll need to either upload your images somewhere, such as a blog or image provider, or pull in images that are already hosted online, like from Wikipedia (https://upload.wikimedia.org/wikipedia/commons/thumb/c/ca/Phoenix_dactylifera100_4209.JPG/90px-Phoenix_dactylifera100_4209.JPG).
  3. In your spreadsheet, create a separate column for your images, with a heading like “Images.” You can include a single image for every location.
  4. Add the URL for every image you want to include in that column.

Then, map your data, as usual, using our free mapping tool. You’ll be able to select the spreadsheet’s “Image” column when you “Show Advanced Options,” if BatchGeo doesn’t discover it automatically.

One note on hosted images: Sometimes Wikipedia or other sites will remove an image or restrict its access. To avoid this, you’ll want to host map images on Dropbox or a similar cloud image service.

The 193 Deadliest Crowd Tragedies Ever Recorded

About half of people would rather stay inside alone than attend a jam-packed event. While most of these people don’t fear death, it’s one of the risks when you are with hundreds or thousands of others. We’ve morbidly gathered more than 193 crowd collapses and crushes that have occurred throughout the centuries. More often than not, these incidents result in an unimaginable loss of life. Yet we still understand very little about these tragic events.

A common misconception is that crowd crushes occur due to the size of a crowd. Their true cause is too dense of a crowd (more than four to five people per square meter). In such cases, the pressure on each individual causes the crowd to collapse in on itself, or become so densely packed that individuals are crushed and asphyxiated.

Most agree the fault lies with poor event organization, and the major crowd disasters of the past could have been prevented by simple crowd management strategies. Nevertheless, these incidents continue to happen at large gatherings such as religious, sporting, musical, or other events.

So let’s take a look at some of the deadliest crowd crushes ever recorded. While the causes and circumstances for gathering do vary, their commonalities may be able to help us better understand these tragic events.

View Fatal crowd crushes in a full screen map

The 10 Deadliest Crowd Crushes

Of the 193 fatal crowd crushes on the map, several have death tolls that far surpass the rest. Each of the following 10 crowd crushes resulted in the deaths of more than 340 people:

  • 2015 Mina stampede: 2,400+ estimated deaths
  • 1990 Mecca tunnel tragedy: 1,426
  • Khodynka Tragedy: 1,389
  • 2005 Al-Aimmah Bridge disaster: 953
  • 1954 Prayag Kumbh Mela stampede: 500-800
  • Iroquois Theatre fire: 602
  • Chongqing tunnel massacre: 461
  • Unnamed: 354
  • Phnom Penh stampede: 347
  • 2006 Hajj stampede: 345

When it comes to the timing of these unfortunate events, four of the ten deadliest have already occurred this century—even though it’s not even half over. With five total incidents having occurred throughout the 1900s, we’re likely to face more crowd crushes in the next decades than ever before.

Location-wise, Saudi Arabia has been home to the highest number of incidents, with three of the top ten tragedies occurring in the country. More than this, however, is the fact that all three of the Saudi Arabian crowd crushes took place in the same city: Mina. Notably, all of these were religious-type gatherings.

The 15 Reasons for Gathering Before a Crush

The 10 deadliest crowd crushes aren’t the only takeaway from the map. The reasons for each gathering that resulted in a crush are worth diving into.

Crowd Crush Gathering Type No.
Religion 42
Sports 36
Concert or Festival 23
Other Recreation 16
Holiday 13
Funeral 11
Nightclub 10
School 9
Politics 9
Aid 9
Military 6
Transportation 3
Shopping 2
Other 2
Execution 2

As you can see from the table above (and on the map when you group by “​​Gathering Type”), religion and sports events are the most common reasons for gathering before a fatal crowd crush, with 42 and 36 incidents respectively.

The deadliest religious-related crowd crushes include the previously mentioned #1 deadliest crush overall, the 2015 Mina stampede. Meanwhile, the Lima, Peru Estadio Nacional disaster is the sports-related crowd crush that saw the most people die (328 estimated deaths).

Concerts or festivals are the third most common reason for gathering before a crowd crush, while other recreation, holiday, and funeral events also had a significant number of incidents, with 16, 13, and 11 incidents respectively.

Nightclubs, schools, politics, and aid-related events had fewer incidents but still accounted for a non-negligible number of fatal crowd crushes. Military and transportation events had the lowest number of incidents, with 6 and 3 respectively. Shopping events and other types of gatherings had only 2 reported incidents each. Finally, there were 2 incidents reported as executions, which is a particularly disturbing finding.

Note that we manually assigned each incident a type—and there is the potential for overlap. For example, a crowd crush during a NYE concert could be classified as both a concert and holiday. Regardless, types can be especially helpful when you map your data with a tool that groups together your data types.

Why You Should Assign Types or Categories to Your Data

For certain kinds of data—even those entirely pulled from an outside source—there is the opportunity to improve your insights by assigning types or categories.

This could be anything from types of gatherings before a crowd crush, as discussed in the previous section, or even reasons for crush, from fires to police instigation.

Not only can this be helpful when viewing your spreadsheet (you can create filters to only show specific data types in Google Sheets, for example), but also when mapping.

These type or category columns will be suggested for grouping, along with other columns in your spreadsheet that may be useful. You and other users of your map will be able to select only the markers that meet certain requirements, filtering out the rest. Groups can be combined to zero in on very specific results, giving you insight into the story behind the map.

Get started today at batchgeo.com.